




One of my friends recently moved into a rather smart executive housing development in Epsom. After a few exhausting days of moving and unpacking…
WHAT WE THINK · INSIGHTS
One of my friends recently moved into a rather smart executive housing development in Epsom. After a few exhausting days of moving and unpacking…
US mega-funds seeking high profitability are boosting renewables in Europe

I really love cycling, but I’ll be the first to admit it’s a bit of a crazy sport. I probably drove my ex-girlfriend crazy…
Filter Publications
99 publications found
Last week, whilst working from home and sitting in my garden during the sweltering heat, I managed to unsettle my normally unflappable Danish colleague…

Last week, whilst working from home and sitting in my garden during the sweltering heat, I managed to unsettle my normally unflappable Danish colleague by inadvertently answering a Teams video call topless.
Now, not only am I by far the oldest person in my company, but I am also firmly in the top three of colleagues you would least like to make that mistake with. So, I am anxiously waiting for an email from HR, whilst also thinking rather a lot about heat.
But before we talk about that, let’s go off on a slight tangent and think about how we collect, treat and consume water.
We build large reservoirs feeding water treatment plants and a network of pipes to bring the resulting clean water to our houses. Water systems in developed countries are shining examples of the power of collective endeavour, which means when it rains in Wales in November, I don’t rush outside with a bucket in Surrey. That’s because someone else catches it, someone else treats it and, the following July, I turn on a tap and there it is.
My key point is that the technology that turns unusable rain into usable drinking water is located centrally, and the transformed product is distributed locally.
Now imagine we had designed water the same way we have designed heating.
Every house would have its own little water treatment plant for the winter rain, and in the summer, we would buy huge amounts of water from rainy countries, pipe it untreated to your house and, if your tiny water treatment plant broke down, then tough.
This sounds absurd, but that is almost exactly how we produce heat in this country.
We buy the raw fuel, gas, and distribute it in untreated form through a vast network of underground pipes before burning it in around 20 million individual heating systems to create the thing we actually want: heat.
This means millions of people solving the exact same engineering problem every winter with their own little gas-to-heat conversion plant, typically called a boiler. If an engineer were designing Britain’s heating system from scratch today, there is almost no chance they would design it this way.
And every year we spend half of our time ignoring the enormous amount of heat that comes from the sky.
Part of my defence to HR is that it really was exceptionally hot last month. In June alone, roughly 3,000 TWh of solar energy fell on the UK.
That is a big, meaningless number until you put it into context.
The UK burns around 700 TWh of natural gas in an entire year. London alone uses around 66 TWh of heat every year.
This means that if you could capture all the heat that fell on the UK in June, you could theoretically heat London for around 45 years.
Now, of course, we cannot capture all of it. But you cannot catch all the rain either. Nobody built Kielder Reservoir expecting to collect every drop that fell on Northumberland. The point is not about capturing everything. The point is capturing enough to make a difference.
Suppose we managed to capture just 10% of June’s sunshine as usable heat. That would give us around 300 TWh, over 40% of our annual gas demand, from just one summer month, and enough heat to supply London for around four and a half years.
And this is not rocket science either.
You capture the heat with solar thermal panels, store it underground in natural aquifers or man-made reservoirs, and bring it back to the surface when you need hot water. Then you connect groups of users together through district heating networks, creating a single point of heat production instead of hundreds of thousands of little boilers.
It is a simple concept, and the Danes, Dutch and Swedes have been using variations of it for decades.
The world’s largest operational example of this is in Denmark, in a small town called Vojens with around 3,500 homes.
The Vojens plant is a snappily titled Pit Thermal Energy Storage (PTES) system. In other words, it stores around 200 million litres of hot water in a giant insulated hole in the ground beneath a floating lid and supplies heat to the town’s district heating network.
During the summer, it is charged using large solar thermal fields and surplus renewable electricity. During winter, the stored heat is released back into the network.
As we’ve already seen, this isn’t especially complicated.
The important number for our purposes is that the plant stores around 12 GWh of heat and supplies approximately 3,500 homes. That is impressive, but it is still tiny compared with UK demand.
If we stick with London as our example and modestly aim to cover just 10% of winter heat demand, we will need roughly 8.8 TWh of seasonal storage.
A Vojens-sized store (12 GWh) would cover only around 0.14% of that requirement.
So, supplying just 10% of London’s winter heat demand would require roughly 700 Vojens-scale stores.
That’s a huge number.
But then everything in net zero is a huge number.
The UK now has well over a thousand solar farms larger than 1 MW and around 700 biogas plants. Building hundreds of thermal storage facilities was not impossible, but historically we chose a different path from the Danes. We spent billions building renewable electricity while largely ignoring how we create, store and distribute heat.
The second problem is historical. More than a century ago, we decided individual heating systems were the best solution. Now almost every house in the UK has its own boiler tucked away like Harry Potter in a cupboard under the stairs. Every large building has its own heating plant in the basement. Very few, if any, share a heat network with their neighbours.
This is the fundamental difference between Denmark and the UK.
Denmark built the pipes and collective heat infrastructure first, then started building seasonal thermal storage.
The UK remains rooted in Victorian individualistic thinking about heat. Changing from an individualistic approach to a collective one in a city like London will be incredibly hard. We cannot suddenly capture London’s summer heat at scale because we would need to build hundreds of kilometres of heat networks and hundreds of thermal storage systems beneath one of the world’s oldest continuously occupied cities.
So, places like London are probably out of the question.
The good news is that new developments are different.
The UK builds around 200,000 new homes each year, many of them on large housing developments.
A 1,000-home development might have a peak winter heat demand of around 5–10 MW and an annual heat demand of roughly 10–20 GWh. A Vojens-sized store (12 GWh) could therefore theoretically store close to a year’s worth of space and hot water heating demand for a development of that size.
This is why new developments are a much easier starting point for district heating and seasonal storage than retrofitting London’s existing housing stock. The pipes, heat source and storage can all be designed in from day one. All it would really take is a relatively minor change to planning rules requiring these systems to be installed from the outset.
Which makes me wonder: why don’t we do more of this?
I think the answer is that the renewable industry in the UK has developed an innate preference for complexity over simplicity.
Look across the UK energy policy landscape, and you will find endless enthusiasm and conferences for esoteric things like artificial intelligence, blockchain, e-fuels, tidal power and other clever technologies.
Things that are difficult and glamorous.
Nobody is hosting conferences called: “Is the future of net zero just digging big holes and filling them with warm water?”
But perhaps they should.
Because maybe it is.
Sometimes the answer is simply looking at an old problem differently. Water taught us this lesson hundreds of years ago. We do not each have our own reservoir and, more pertinently, we do not each treat our own water.
We built a network that relied on collective rather than individual transformation technology and, despite its current travails, the UK water and sewage system remains a remarkable piece of engineering.
We could do the same with heat.
In conclusion, I hope I don’t get sacked for answering a Teams video call topless.
In my mitigation, it was a really, really hot day and my colleague Nichlas sort of saw the funny side.
Every summer Britain receives an astonishing amount of free heat from the sun.
We admire it, complain it’s too hot and then let almost all of it disappear.
Come January we vaguely wonder where all that energy went and then go out and buy more gas and therefore more heat from the US and the Middle East.
We don’t do this with water because, on a rainy island, it would be ridiculous not to store it.
In an increasingly hot Britain, heat deserves exactly the same treatment.
The answer to decarbonising heat isn’t hidden in some futuristic technology. It doesn’t require another fashionable technology with a three-letter acronym.
Hopefully, for my sake, it doesn’t involve HR either.
The answer to heat has been sitting there all along. Quietly beneath a floating lid in a very big hole in the ground, next to an unremarkable little town in Denmark.
When it comes to generating power, big doesn’t necessarily mean beautiful anymore. Why power stations are getting smaller and more local, and what does…
When it comes to generating power, big doesn’t necessarily mean beautiful anymore. Why power stations are getting smaller and more local, and what does this mean for both industrial users and the National Grid?
There is a light in my house that doesn’t have a switch. It stays on constantly unless we remove the bulb, and, despite living here for fifteen years, we have never found a way of turning it off. I don’t think it is even connected to the fuse board, but the last three owners have extended and remodelled the house so extensively that its wiring has become an opaque mystery.
In a similar vein, I don’t really understand how electricity works. Despite spending the second half of my career in renewables, I’m at best hazy on the difference between alternating and direct current, I don’t really know how inverters work, and the transmission system remains a mystery to me. In my head, it is some sort of giant loop that somehow links my orphan light bulb to a distant power station (but not apparently via a switch).
One thing I did learn while researching this blog is that electrons don’t actually move very much at all. It is more realistic to imagine a long line of an inconceivably large number of tiny little snooker balls stretching from your kettle all the way back to the power station. When the turbine spins, the energy moves through the system rather like one of those Newton’s cradle toys that used to adorn your boss’s desk in the 1990s. Each electron merely nudges its neighbour while the energy surges along the wire. The electrons themselves drift only very slowly, so you have probably had some of the same electrons in your house for decades.
The reason I have been thinking about all of this rather than the World Cup is that one of my current mandates involves distributed, “behind-the-meter” power. For those unfamiliar with the concept, this means factories and, increasingly, data centres are partially or wholly disconnecting themselves from the grid by locally generating their own electricity through solar panels, wind turbines, combined heat and power (CHP) units, and fuel cells. We are also seeing an emerging role for biomethane in supplying green gas to distributed CHP plants thereby taking out the electricity grid all together.
This represents a paradigm shift away from the traditional generator-transmitter-user model towards something less linear, where users and generators begin to merge with the transmission system becoming more of a backup than the sole provider.
It also means that power stations will start to get smaller, which goes against the grain of the existing consensus in industrial nations that big is beautiful. If somebody asks why a project needs to be large rather than small, you can sagely say “economies of scale”, and that quickly shuts down the debate. Similarly, the Russian dictator Stalin used to remove his pipe and menacingly declare that “quantity has a quality all of its own” when discussing the vast but unsophisticated Soviet army. This also tended to shut down the debate, albeit for different reasons, so if you like building big stuff, you’re in famous albeit rather dubious company.
The National Grid is a classic example of this build big stuff philosophy. The post-war generation built about 100 enormous power stations and connected them with around 4,500 miles of high-voltage transmission lines and more than 500,000 miles of local distribution networks to deliver electricity from these distant monoliths to homes and factories. At the height of our obsession with gigantism, we built projects such as Drax, still the largest power station in the UK and once the largest in Western Europe. Before that, we built the iconic Battersea Power Station, famously constructed from around six million bricks.
To some extent, we remain beholden to this “big is beautiful” paradigm. Hinkley Point C, which will generate 3,260 MW of electricity, is currently being built behind thick concrete walls on a remote stretch of the Somerset coast, more than 100 miles from the UK’s main centres of population. That said, this distance and the depth of those walls may also tell us something about how safe the nuclear industry itself believes these ‘controlled’ chain reactions really are.
At the same time, however, falling costs for solar power, batteries and other distributed technologies are beginning to reverse a century of thinking. In electricity, as in many other industries, it may turn out that the optimal size of a generating unit is much smaller than we once believed, and increasingly we are seeing the growth of little local power stations.
The advantages for industrial consumers are threefold:
This last point is becoming a major issue for data centres. A large hyperscale facility may require around 100 MW of power yet find itself waiting years for a connection. As I write, the UK’s grid connection queue contains more than 700 GW of proposed generation and storage capacity spread across more than 2,000 projects, with some applicants being offered connection dates well into the late 2030s. One of my American clients received a connection offer for his multi-million-pound UK data centre this week for September 2037. He got up nice and early and cheerfully rang UK Power Networks from New York because he genuinely assumed 2037 was a typo.
The impact of this shift is profound. Simply maintaining the existing transmission and distribution networks costs around GBP 10 billion per year, and this is ultimately recovered from electricity users. Furthermore, this vast web of cables creates its own metaphysical problem of maintaining system frequency and simply keeping the electricity system in balance costs around another GBP 2 billion a year. None of this second GBP 2 billion generates a single extra watt of electricity; it merely keeps the existing energy flowing within tight tolerances so that your lights stay on and your television doesn’t flicker.
As more and more large consumers shift to behind-the-meter generation, the economics of running and paying for the grid begin to change. Every factory or data centre that generates its own electricity reduces the burden on the transmission network and weakens the assumption that ever larger, ever more distant power stations are the most efficient way of supplying energy. It also reduces the pool of users paying for transmission and balancing services, so the grid could eventually slide into a downward spiral in which fewer users pay ever higher charges because everyone else is opting out.
I probably won’t ever really understand how electricity works or why that light won’t turn off. On a bigger scale, the electricity grid is unlikely to disappear, but it may increasingly evolve from being the sole source of power into a backup system that connects thousands of smaller generators rather than a handful of giant ones. This, in turn, will have profound implications for how the GBP 12 billion cost of maintaining and balancing that network is paid for in the future. The old paradigms about how to generate and transmit electricity are changing, and Hinkley Point will probably be the last big power station we ever build. It’s the generation equivalent of excitedly opening a new Blockbuster franchise. Tellingly, its predecessor as the biggest power station in the UK, Battersea Power Station, is now converted into luxury flats, niche little restaurants and shops because big isn’t beautiful anymore.
After 20 years of marriage, I am thinking of divorcing my wife because she won’t buy petrol. I still love her madly, but she…
After 20 years of marriage, I am thinking of divorcing my wife because she won’t buy petrol. I still love her madly, but she has this incredibly annoying habit of taking the car out with the petrol light on, driving on a jaunty 20-mile round trip, then bringing it back with the seat too far forward, the radio on too loud, and that little pump light now angrily flashing. This sounds trivial, but after 20 years and eight different cars, it has become unbearable.
I won’t divorce her, of course. Instead, I’ll just write irritable introductions to blogs about energy storage and the importance of refilling the tanks.
There is a lazy habit in European energy policy of describing every turning point as “a structural change.” Usually, they aren’t. They are typically just incremental shifts and variations around existing systems. But gas in Europe right now genuinely feels like one of those moments where the structure has changed. Like Dorothy in the Wizard of Oz, unexpected events have suddenly put us in a very different place.
The essence of this blog is that the format of European gas supply has changed from pipelines to ships. We are now competing on a global scale. Europe is no longer filling up its gas storage in the summer because the price is too high, and every year the situation is getting worse. Biomethane makes a slight difference, but “slight” is a smaller word than “big”. One cold winter’s day, this issue is going to bite.
The big picture: What happened to Russian gas?
Before 2022, the EU consumed roughly 400 bcm of gas a year. Russia supplied somewhere between 155 and 180 bcm of that total through various pipelines: Nord Stream, Yamal-Europe, Brotherhood and the TurkStream extensions. This gas that arrived at a more-or-less constant rate, day in, day out, with the seasonal swing handled by storage. It was predictable, boring, and not really the subject for a blog.
Today, the picture is very different. EU consumption has fallen to around 330 bcm through demand destruction, partly through efficiency, and partly because some industry simply isn’t coming back. Pipeline imports from Russia have collapsed to a rump. The Ukrainian transit route shut at the end of 2024, leaving only TurkStream to deliver Russian molecules to the EU. In this new world, our gas comes from Norway, the US, or the Middle East, and a significant portion arrives in ships rather than via pipes. We will talk about the long-term implications of this shift a bit further down.
Although Russia is largely out of the European picture, it may be creeping back in at the edges as politicians start to fret about the 40% leap in gas prices so far this year. There is tentative talk of ‘easing’ sanctions, and presumably, this news is going down better in Moscow than in Kyiv.
The problem with storage
Because of seasonal variation in demand, we store a lot of gas. Gas supply is fairly constant, but gas demand is highly seasonal, meaning we must use the summer months to top up. In the halcyon days before the conflicts in Ukraine and Iran, the seasonal rhythm was fairly stable. We would end the winter with 35–45 bcm left in storage, meaning the refill light was on but not flashing. We would refill with 55–60 bcm and go into the chilly autumn season with the tanks 90 – 95% full. It was simple and nothing to worry about.
But there is a catch. Two things are quietly happening under the surface.
The reason for this is price.
Normally, the forward gas curve is in contango. This is not a Latin dance, but a scenario where winter contracts trade above summer contracts because gas is more valuable in winter when you actually need it. That price spread provides the economic incentive to store in summer and withdraw in winter. It sounds simple, but it only works if there is a significant arbitrage between summer and winter prices.
The required seasonal price spread is EUR 5–15/MWh. This year, however, it has been as low as EUR 0–5/MWh, and sometimes the market flips into a new world for most of us: backwardation (this is a great Scrabble word if your brother-in-law has already put down “backward”).
Backwardation occurs when current summer prices are more expensive than forecast winter ones, meaning nobody wants to store. Because of this, we are not filling the tanks at the required rate. Every day we fall short, we need to put even more in the next day.
So, what has changed?
The first big difference is that, as we said above, we used to buy a lot of Russian gas that came from a pipeline, and now we buy a lot of US LNG that comes from a ship.
That sounds fine until you think about what it actually means. A pipeline is a continuous, deterministic flow. An LNG cargo is about 0.09–0.10 bcm of gas inside a steel hull that has to physically arrive on a particular tide, get regasified, and be pushed into the grid.
This is the detail the headlines keep missing. We didn’t just swap one supplier for another; we swapped a flow from a pipe for a schedule of ships. Ships, by definition, are a lot more mobile than pipes, meaning they can take that LNG to whoever is willing to pay the most.
Consequently, we are now competing directly with Asia to attract these ships. If there is a hot summer in China (requiring more gas for air conditioning) or a cold winter in Japan, the price spikes and the captain of our LNG ship metaphorically and literally changes course. Although gas is relatively marginal in the Chinese energy mix, a hot day can add 30 – 30 mcm of demand per day, taking a massive chunk out of the European 400 mcm daily refill requirement.
To put this in context, 10 bcm of gas is roughly 100 cargo ships. We need 1,500 – 1,700 ships to come to Europe every year, but they can now go to whoever pays more. Suddenly, we are competing in a global auction, whereas previously we only had to deal with the Russians.
Before we turned off the pipes, our Russian friends supplied 150 bcm/year of gas at peak. Because it was a physical pipe and not a ship, we could adjust flows seasonally, store under pressure in the system (another new word, “line packing”), and act as a balancing lever in tight markets
All of that is gone. We have replaced it with a combination of Norwegian gas and US LNG, shifting fundamentally from a controllable pipe-based system to a competitive, mobile one. This is problem number one, and it is partly why the markets have moved from contango to backwardation.
Iran, the Strait of Hormuz, and Ras Laffan
Problem number two is that little stretch of sea along the coast of Iran. As you will have seen in the news, roughly 20% of global LNG flows pass through or near the Strait of Hormuz. Shutting the Strait for even a few weeks can remove 10–15 bcm from the global supply chain, just as we are starting to replenish our tanks. Remember, we need 60 – 70 bcm in 2026, so 10 – 15 is a meaningful chunk of our summer replenishment.
To make it worse, Qatar’s Ras Laffan liquefaction complex has been damaged in the same conflict. Gloomy industry estimates suggest around 17% of Qatari liquefaction capacity will be offline for three to five years. Qatar was supposed to be the balancing force underwriting Europe’s LNG bet, but now the maths no longer quite adds up.
Predictably, this is feeding through into prices. The Dutch TTF price was at one point nearly double the pre-war level and remains 30% above normal, even during these low-demand summer months. What the price will be during the cold winter is anybody’s guess.
What about biomethane?
Biomethane often gets mentioned as part of Europe’s gas replacement story. While production is growing, the scale remains modest. Current production sits at 4–6 bcm/year and could grow to 20–30 bcm/year by 2030. So, at best, it meets 10% of our current refill needs, though it could get to 50% if we build a significant number of biomethane plants. This is precisely why we need to do exactly that.
And the impact of demand destruction?
On a positive note, the response to the Ukraine crisis triggered a major shift away from gas towards electricity. Gas consumption in Europe is roughly 80 – 100 bcm lower than it was pre-2021. However, in the first seven months of 2025, EU gas demand rebounded by about 5%. Some of that is weather-driven, some of it is industry tentatively returning to gas, and some of it is the power sector switching to gas as coal exits the mix.
In summary, that little light is still flashing
This blog can be condensed as follows
I won’t divorce my wife just because she won’t put petrol in the car. I will just get mildly annoyed every time I see that petrol pump light, have to turn the volume on the radio down, and retune it back to Radio 4. Similarly, Europe probably won’t run out of gas this winter, but it may get very uncomfortable in the autumn if the weather turns cold and the Strait is still closed. Either way, it means we will start 2027 with less in the system, compounding the problem.
At the current refill rate, we face either periods of very high prices on cold days, as Europe competes to outbid Asian buyers for those annoyingly mobile LNG cargoes, or the politically difficult prospect of temporary demand curtailment. In plain terms, this means turning down the heating and having no hot showers in February.
The structure of the European gas market has fundamentally changed because of events entirely outside of our control. Suddenly, we are no longer the monopoly buyer at the end of a Russian pipe. We are just another bidder for LNG ships, several of which are currently stuck in the Strait. Things are very different now; like Dorothy and little Toto, we are not in Kansas anymore.
When I left university, I took a job in the Civil Service and almost immediately regretted it. It wasn’t even a bad job, which…
When I left university, I took a job in the Civil Service and almost immediately regretted it.
It wasn’t even a bad job, which was part of the problem. The office was clean. The coffee machine mostly worked. There was a lunchtime Subbuteo league that some people took far too seriously. The work had a vague sense of purpose. I met my first wife there. On paper, it ticked a lot of boxes: progression, stability, a respectable CV. All that stuff.
In reality, it felt terminal. A career and a wife in my early 20s, before anything had really started. I remember thinking I’d probably stopped the search at least one decision too early.
Forty years later, I think we’re doing something similar with UK biomethane. Not the wrong thing, just stopping asking questions too early.
The comfort of that first working answer
The UK biomethane sector is built on first working answers. Take organic waste. Digest it in big tanks. Clean the gas. Burn it or inject it into the grid. Move on.
We now produce roughly 7–8 TWh a year, with policy ambition stretching that to 10–15 TWh by the early 2030s. Respectable numbers, until you remember the UK still burns something like 750–850 TWh of gas annually. So yes, the needle has moved. Just not very far.
Underneath that is a slightly inconvenient detail. Biogas isn’t really “gas”; it’s a mixture: roughly 55–60% methane and 40–45% CO₂. To make it ready for the fussy National Grid, you have to strip out CO₂ and, most of the time, vent it.
This is usually justified as “circular carbon”. The CO₂ came from the atmosphere; it goes back to the atmosphere. No harm done. It is circular, provided you count the edge of space as the boundary of your circle. That said, a few plants now capture their CO₂ and sell it to the food industry, but most don’t. And “most” is a different word from “few”.
What if we don’t stop at biomethane?
Biomethane is already an improvement on fossil gas. But treating CO₂ removal as the end of the story is a bit like accepting the first job offer and deciding that the Civil Service must be your career.
Yes, biomethane works. It moves the decarbonisation dial a little bit, so let’s call it there. But what if we keep going? What if it’s a question mark and not a full stop? Methanol could be the answer to the next question: “If we’ve gone to the trouble of separating out the CO₂, why not use it?”
The slightly awkward chemistry bit
As you will recall from school, methanol is CH₃OH: one carbon atom, four hydrogen atoms, and one oxygen atom.
We already have the carbon and oxygen sitting in the CO₂. What we don’t have is the hydrogen. This is essentially a game of chemistry Countdown, but with atoms instead of vowels and consonants.
If we add back hydrogen, the equation looks reassuringly simple:
CO₂ + 3H₂ → CH₃OH + H₂O
In practice, it involves a lot of heat, pressure and catalysts. But none of this is new. Methanol synthesis is a mature industrial process. The only novelty here is where the CO₂ feedstock comes from.
Efficiency, or something like it
At this point, someone will sigh and say, “Yes, yes, Michael, but what about energy efficiency?”
Injecting biomethane into the grid to burn for heat is maybe 90–95% efficient, which is pretty good. Turning CO₂ and hydrogen into methanol is, well, not quite that.
Methanol contains roughly 20 MJ per kilogram. Producing might take 40–50 MJ of energy per kg, sometimes more.
On paper, it looks like a terrible idea: putting 50 MJ of energy in to get 20 MJ back.
But that assumes the energy going in is scarce and valuable. Increasingly, that’s not always true. A large part of future hydrogen could be produced from curtailed renewable power.
In the UK today, wind curtailment is already in the order of 5–10 TWh per year. It is projected to rise significantly as offshore wind capacity expands faster than the transmission and storage bits of the system can handle the electrons. This curtailed energy could be as much as 18–36 petajoules (PJ) of energy annually. Which, hey presto, we could use to make hydrogen and run the process for our methanol factory.
Flexibility beats efficiency
Methanol has a big part to play because we don’t use energy for one thing anymore. Gas grids are brilliant at one job: delivering heat. Everything else involving that gas is awkward.
Methanol is different. It’s a liquid at room temperature. You can store it, ship it, move it, and use it to power things that can’t be attached to pipes or cables. Like ships and trucks. In the rock, paper, scissors game of modern energy systems, flexibility often beats efficiency. Methanol is your flexible liquid friend who goes to Pilates, compared to your other gaseous friend who goes to the pub.
Demand is not the problem
Global methanol demand is already around 110–120 million tonnes a year and rising every day as industry moves from announcing net zero targets to reluctantly trying to meet them.
Shipping is the interesting bit. Shipping has spent a long time quietly keeping its head down while everyone else tries to reduce carbon emissions. As we have discussed in previous blogs, they are not going to get away with that much longer.
Shipping knows this.
People in shipping are, by definition, good at spotting things on the horizon and changing course accordingly. To date, over 300 methanol-capable ships are now in build or on order. Mixing our metaphors horribly: once shipping starts buying, methanol demand will really rocket.
Using the carbon we already have
At the current UK biomethane output of 7–8 TWh per year, you end up with roughly 400,000 – 500,000 tonnes of CO₂. Which we mostly vent to the atmosphere.
If you captured it and converted it, you could produce approximately 250,000 – 300,000 tonnes of methanol per year.
The hydrogen required would equate to roughly 15–20 PJ of energy input, depending on how you design the system. Conveniently, that’s not far off the energy we already curtail from wind.
At this point, I can imagine my colleagues who work on hydrogen schemes composing angry Teams messages to me. They want that curtailed energy to make hydrogen. So do we, but we don’t want to stop there. Hydrogen as an energy carrier is difficult; it’s a gas, it’s very small, so it’s leaky, and it goes bang with alarming frequency. Going one step further and turning it into methanol is a lot more sensible.
The economics: no longer ridiculous
For a long time, bio-methanol sat firmly in the “interesting but uneconomic” category.
Renewable methanol made with renewable energy currently lands somewhere around EUR 350–700 per tonne, depending largely on hydrogen cost. Fossil-based methanol is closer to EUR 200–300 per tonne.
The gap is no longer vast. It’s the sort of gap that policy, carbon pricing, or emissions standards can plausibly close, particularly in sectors like shipping where alternatives are limited.
The UK habit of stopping too early
In the UK, we are great at inventing stuff, then letting other people (mainly Americans) run with it. The telephone, the internet and the jet engine – all invented by clever Brits, but the full potential was realised elsewhere.
There is a risk that the same thing will happen again with biomethane. After the Germans and the Chinese, we have the third-largest number of plants in the world. We know the UK biomethane sector works. It produces gas. It meets targets. It generates certificates. It puts renewable gas into existing infrastructure. It works properly, but it could be much more interesting.
The next obvious step is to capture the CO₂, blend it with hydrogen produced from curtailed wind energy, and make methanol for shipping. It’s not easy, or straightforward, but as the little magnet on my fridge says: “Life begins at the end of your comfort zone”.
Making it happen
The key is probably merging carrots and sticks into a coherent energy policy soup. We already incentivise biomethane production with the Green Gas Support Scheme, legacy ROCS and FiTs. What we don’t do is encourage anyone to use the resulting CO₂ or discourage plants from venting it, which is where the merge bit comes in.
Give shipping and trucking either a carrot or a stick to use methanol and simultaneously start penalising biomethane producers who don’t capture their CO₂. Probably easier to write in a blog than to do in practice, but that’s the point of policy, to pull disparate threads together rather than rely on market forces.
Not stopping at good enough
I still think about that first job. Sometimes my first wife, too. Not because they were mistakes, but because they felt like complete answers to questions I hadn’t fully asked. Energy systems sometimes do the same thing: stop asking questions too early.
Biomethane-to-grid is a perfectly sensible answer. Clean, incremental, defensible. But it is still an answer that risks becoming an endpoint. Methanol is what you get when you ask: “Yes, but what about that CO₂stuff going out the pipe?” Given current UK biomethane volumes, the next step is roughly 300,000 tonnes of methanol per year that could be made from CO₂ we are already producing but just not using properly.
We can keep things as they are: biomethane in, circular CO₂ out, keep saying “circular, not additional”. Or we can take one more step and turn that CO₂ into a flexible liquid fuel to power trucks and ships. Neither path is wrong. But the former assumes the first acceptable answer is also the final one, whereas the latter asks, “Yes, but what else could we do next?”
Energy systems, like lives, rarely fail because they start badly. They fail because they stop asking questions about that next step too early.
Recycling enjoys a special status in modern urban life. It is one of the few activities that lets us feel morally upright while doing…
Recycling enjoys a special status in modern urban life. It is one of the few activities that lets us feel morally upright while doing something mildly dirty on a wet Tuesday night.
I live on a leafy street in Epsom, south of London. We wash our cars, cut our grass, and paint our houses. It’s that kind of safe, beige place where very little happens. Probably the most important civic act is to be seen putting your waste in the correct recycling bin.
When we had some building work done a few years ago, one of our neighbours anonymously reported us to the council, and then the police, because they felt we were putting too much unsorted waste into our skip and not enough into the recycling bin. True story. Apparently, the thin blue line now extends to plasterboard.
This small drama neatly illustrates how kerbside recycling has become a kind of secular religion for the urban middle class. Moral redemption is available through yoghurt pots, while unsorted builders’ skips have become the physical manifestation of sin. That’s entertainment in suburbia.
The awkward truth for my neighbour is that recycling behaves far less like a virtue and far more like the temperamental industrial process it actually is. Feed it clean, simple materials, and it works well. Feed it complexity, contamination, or clever design, and it becomes expensive, inefficient, or pointless from a sustainability perspective.
This is not primarily a behavioural problem. It is not fixed by better signage, clearer labels, or calling the police on your neighbours. Recycling is a physics problem, and physics has never been particularly sensitive to middle-class opinion.
Waste is a collective noun for lots of other stuff
Europe generates roughly 2.1–2.3 billion tonnes of waste every year. By mass, it looks something like this:
| Mineral waste from construction, demolition, and soils | ~35–40% |
| Organic and biomass waste | ~25–30% |
| Metals | ~10–12% |
| Paper and cardboard | ~10% |
| Plastics | ~7–9% |
| Glass, textiles, wood, and others | The remainder |
Most waste is not bottles, cups, or packaging. It is concrete, rubble, soil, timber, and structural material. Even within tidy statistical categories, purity is rare. Nearly all waste is mixed, bonded, coated, glued, dyed, laminated, and contaminated, because that made products cheaper, lighter, shinier, or more convenient at the time.
The Second Law of Thermodynamics tells us that closed systems naturally move toward disorder, or higher entropy, as energy becomes more dispersed and less useful. As any parent of toddlers will confirm, this law is robustly enforced by God.
Recycling attempts to run that process backwards: to recreate order from chaos. That is why it always requires usable energy to be put back in.
A useful way to picture this is my sinful skip. At the start of the week, it was empty and orderly. Within days, it contained timber, plasterboard, paint tins, insulation, cables, nails, coffee cups, a dead cat, and a surprising quantity of additional material deposited by passers-by who had clearly reached their own conclusions about who was renting the skip. By the end of the week, it was a dense, chaotic mixture of perhaps fifty materials, some firmly bonded together, some dead, and quite a lot of stuff that wasn’t ours.
Recycling asks us to reverse that process: to turn the full skip back into its original components – neat, homogeneous piles of timber, copper, steel, glass, plastic, cardboard, paint, and ideally living cats. That reversal is almost possible (not the cat bit), but only with energy, machinery, labour, and cost. The more enthusiastically we mix materials, the more difficult and energy-intensive the unmixing becomes.
That energy manifests as electricity for shredders and optical sorters, heat for furnaces and reprocessing lines, diesel for transportation, chemicals for washing and separation, all to unpick the complexity we designed into the products in the first place. At some point, recovery becomes more expensive than making something new, but we still make people do it. That is the dirty, unspoken secret of the recycling industry.
Why metals behave the way they do
Metals are the great exception, and the main reason recycling still has a good reputation.
Steel and aluminium are chemically simple, structurally robust, and physically cooperative. They respond to magnets, eddy currents, and density differences. They melt when asked. They also tolerate repeated recycling without complaint.
Aluminium can be recycled almost indefinitely, using around 95% less energy than producing primary metal from bauxite. As a result, Europe recycles roughly 75–80% of steel packaging and 70–75% of aluminium packaging.
Here, physics is on our side. The material wants to be recycled. If all materials behaved like aluminium, this piece would be much shorter and my neighbours considerably calmer.
Plastics: a chemistry problem dressed up as a waste problem
There is no such thing as “plastic”. It is a collective noun for polymers – PET, HDPE, LDPE, PP, PS, PVC – each with different melting points, chemical behaviours, and degradation pathways. Treating them as interchangeable is wishful thinking. Add pigments, fillers, multilayer films, and adhesives, and entropy rises rapidly.
Sorting plastics back into clean polymer streams is labour- and energy-intensive. Almost the hardest thing to recycle economically is a cheap coloured PET water bottle with a PVC cap: a triumph of consumer convenience and a recycling nightmare.
Mechanical recycling degrades quality, so most recycled plastics are down-cycled into lower-value products like drainpipes or garden furniture. Chemical recycling exists, but often at energy costs that rival or exceed virgin production. This is why plastic recycling businesses struggle whenever oil prices fall.
The numbers reflect this reality. In Europe, only around 30–35% of plastic waste is recycled, and much of that is never recycled again. A significant share is burned, landfilled, or exported. This is not because people are stupid or lazy: it is because the chemistry of plastic is awkward and largely indifferent to enthusiasm.
Is glass guilty too?
Glass sits in an uncomfortable middle ground. Clear glass, moved short distances and remade into bottles, usually saves energy compared to virgin production. Exporting mixed-colour glass halfway around the world only for it to end up as road aggregate almost certainly does not.
However good it makes you feel in your hungover state, driving your fossil-fuelled car to the bottle bank to carefully separate coloured wine bottles may not be reducing emissions at all. In some cases, it probably increases them.
Paper: recycling with an expiry date
Paper looks like a success story. Europe recycles around 70–75% of paper and cardboard. But cellulose fibres shorten with each cycle. After five to seven loops, they are too weak to use again and end up in a landfill.
Paper recycling delays the need for virgin pulp; it does not eliminate it. Think of it as a stay of execution for the tree. This is not a policy failure. It is physics doing what physics does.
Organic waste: biology, not industry
Organic waste—food, garden, and agricultural residues—makes up roughly a quarter of European waste by mass. Recycling here is biological rather than industrial. Composting and anaerobic digestion rely on microbial systems that are sensitive and easily disrupted.
That said, turning organic material into biogas is a genuine European success story. Europe now produces over 5 billion cubic metres of biomethane each year, largely by letting bacteria do what they have been doing in your stomach for millions of years, but now in a steel tank.
Composite products: engineering triumphs, recycling failures
The hardest problems appear when we mix materials.
Take your smartphone. It contains aluminium alloys, copper, gold, silver, rare earths, glass, lithium-ion batteries, multiple polymers, and a lot of glue, all compressed into a slim, addictive rectangle. Each material is chosen for performance or cost. Almost none are chosen for disassembly.
Phones are masterpieces of engineering and almost unimaginably hard to recycle. Most recyclers chop them up, retrieve the precious metals, and give up on the rest.
This pattern repeats everywhere. Food packaging is plastic and paper glued together. Cars are increasingly glued rather than bolted, producing “car frag”: the mixed shredded residue left after valuable metals are removed. It’s plastic, cloth, glass, rubber, foam, paint, and milkshake stains. It’s nasty stuff, and most of it ends up buried quietly in a landfill.
From a physics standpoint, bonding mixed materials together is the enemy of recycling. Mechanical fasteners can be undone. Chemical bonds usually cannot.
The missing metric: energy per kilogram
Elsewhere in the energy system, we tolerate uncomfortable numbers. Biomethane plants are judged on grams of CO₂. Solar panels on lifecycle emissions. Almost every infrastructure project includes a detailed energy analysis.
Recycling largely escapes this scrutiny.
Policy still focuses on weight-based recycling rates: tonnes collected; percentages diverted from landfill so a tonne of aluminium and a tonne of mixed plastic count the same, despite radically different energy requirements.
What is missing is a simple but awkward metric: megajoules of energy per kilogram of usable recycled material.
This would allow honest comparison between recycling streams. It would reveal where recycling genuinely saves energy and where it functions mainly as a self-esteem exercise for angsty middle-class people. It would expose perverse outcomes where energy-intensive recycling looks virtuous on paper but performs poorly in practice.
Energy transparency would not kill recycling. It would simply discourage us from burning fossil fuels to turn mixed plastic into cheap garden furniture.
Toward an energy-literate circular economy
European waste policy has delivered progress, but at a largely unknown energy cost. By focusing on weight and percentages, we have ignored the energy required to reverse entropy. The Second Law of Thermodynamics has never read an EU directive, but it remains unforgiving.
Because we do not routinely measure energy use, we design products that are almost impossible to recycle without disproportionate effort. We then act surprised when this proves difficult.
Recycling is not a miracle. It is sometimes easy, sometimes hard, often wasteful, and always energy hungry. Account for this honestly, and it can deliver real sustainability. Ignore it, and recycling becomes a comforting story we tell ourselves while using large amounts of energy to feel virtuous.
We never did discover which neighbour complained, or the name of the dead cat in our skip. We also never found out how much energy was used to recycle its contents—because nobody cared enough to measure it. And that, dear reader, is the essence of the problem.
We finally got our shower fixed last week. It is not the strongest opening line for a blog, but trust me, this gets a…
We finally got our shower fixed last week.
It is not the strongest opening line for a blog, but trust me, this gets a tad more interesting.
The shower didn’t fail catastrophically. There was nothing dramatic enough to justify an emergency call-out. For about a year, it had been doing that familiar shower thing of suddenly oscillating between scalding and arctic temperatures, accompanied by a low, ominous rattle somewhere behind the tiles. We put up with it because getting a plumber in London is harder than it should be. Water, albeit at widely varying temperatures, still came out, so we didn’t bother.
The cause was mundane. It was a worn cartridge that cost £200 to fix. It wasn’t big or scary. It was just enough to make a basic, everyday thing slightly less effective until someone cleverer than me paid attention to it.
Like our humble shower, large energy systems fail in boring ways far more often than they fail spectacularly. Biomethane, as an industry, lives almost entirely in this unglamorous space between “sort of working” and “working properly”. Like the shower, it can look fine right up until small, persistent inefficiencies quietly start to add up.
Fixing these little problems matters
Solar has scale. Wind has drama. Hydrogen has a mad optimism from its devotees bordering on theology. Biomethane, by contrast, is faintly dull. It smells a bit, requires planning permission near residential areas, and depends on an unstable biology that produces molecules rather than electrons. And yet, if the UK and Europe are serious about security of supply, resilience, and decarbonising the parts of the energy system that electrification won’t reach for decades, biomethane is not a sideshow. It has a substantial speaking role in the main act, Part II.
What is changing, quietly, incrementally, and without much fanfare, is how Artificial Intelligence (AI) is being used to improve gas yields from anaerobic digestion (AD) and biomethane plants. Not in the “AI will solve climate change” sense, but in the more interesting “AI might finally help the system run as it was supposed to” sense.
The unspoken thing of biomethane performance
It’s a bit of a secret in the industry that most plants do not operate at their theoretical optimum. Thousands of plants were built in the last decade during a rush to qualify for subsidies. At the time, getting molecules or electrons into the system was more important than optimising gas yields. There is an installed European capacity of 7,000 plus plants, often characterised by suboptimal feedstock menus, overly conservative operating regimes, poor data integration, and reactive rather than proactive maintenance. These factors combine to keep yields perhaps 10–25% below what could be achieved from the same installed capacity.
Why 15% is a big deal
Europe now has more than 1,600 operational biomethane plants injecting close to 7 billion cubic metres (bcm) per year into gas networks. The UK, by contrast, has just over 100 grid-connected plants, producing roughly 10–20 TWh annually – around 1–2 bcm of gas.
In a system where revenues are capped by subsidy limits, feedstock availability, and rising costs, gas yield is everything. A few percentage points of additional methane recovery add up to potentially more than a billion cubic metres on a European scale. This is where AI, properly applied, starts to matter.
What AI actually means in an AD context
AI in biomethane plants isn’t about radical change. It usually boils down to three rather prosaic things:
AD plants already generate vast volumes of data, including feedstock composition, volatile fatty acids, pH, temperature, loading rates, gas composition, parasitic energy use, etc. The problem has never been data scarcity; it has been a lack of usable insight. AI systems can identify patterns invisible to a spreadsheet and turn them into actionable guidance.
Feedstock management: where yields are won or lost
Gas yield is ultimately a feedstock problem. AD plants don’t rely on electronics or mechanics; they rely on Mother Nature, which is messy and unpredictable. No two tonnes of food waste are identical. Agricultural residues vary seasonally. Fats, oils, and greases are both literally and metaphorically slippery customers.
AI models can help overcome this complexity by creating digital twins that predict how specific feedstock blends are likely to behave in a given digester. Operators can then push the biology to the optimum mix while taking account of gate fees, carbon intensity and gas prices. This isn’t about chasing maximum output every day. It’s about knowing how far to push without upsetting the bacteria. Often, it unlocks meaningful gains without a single new piece of hardware.
Process optimisation beyond rules of thumb
Many AD plants still operate on decades-old mental rules developed by experienced operators who smell vaguely of manure and have feedstock under their fingernails: keep temperatures steady, avoid shock loading, watch your Volatile Fatty Acids, that sort of thing.
Digital twins build on this experience by spotting early warning signs of digester stress. Subtle shifts in gas composition and micro-trends in alkalinity are predicted well before they become obvious. This enables earlier, gentler interventions. The results are happier bacteria, faster recovery, and more consistent methane production.
Predictive maintenance and parasitic losses
Yield is also about what steals energy before gas ever reaches the grid. Like my shower, compressors, pumps, and membrane units degrade slowly. AI-driven predictive maintenance can identify declining performance weeks before inefficiency shows up in monthly reports. Fixing a compressor early can deliver more gas than endlessly tweaking feedstock ratios. These are boring gains, but they are real.
Carbon intensity: the invisible constraint
AI is increasingly intersecting with carbon intensity (CI) scores, which drive certificate prices and profitability. Every megajoule of biomethane injected now carries a CI score: a quantified measure of the CO2 emissions created from feedstock collection through digestion, upgrading, and grid injection.
The policy shift from straight subsidies to CI-driven certificates has made your average plant operator’s life just a bit harder. Monoculture maize plants were much easier to run. Not easy, but easier. Today, multi-feed stock plants require a daily or even hourly multi-variable calculation of gate fees, CI scores, biological impacts and certificate prices. Choosing between expensive high-yielding maize or cheap low-yielding cow manure is hard maths to do while on the phone to an impatient farmer. AI models can track these inputs in real time to maintain the balance. They weigh the cost of feedstock against the needs of the bacteria and the impact on CI scores
Using AI to improve CI scores is subtle, nuanced and deeply unglamorous. It is precisely the kind of incremental improvement to the installed capacity of existing plants that we need to move towards the 2030 targets without rewriting the entire energy system.
Necessary, but not sufficient
Even if AI helped every plant in the UK and Europe improve yields by 10–15%, it would not solve the underlying scale problem. AI isn’t magic. It’s a quiet janitor sweeping up existing inefficiencies off the floor, one datapoint at a time.
Europe’s current biomethane output (~7 bcm per year) is in contrast to gas demand of roughly 400 bcm annually. If biomethane is to make a serious contribution, it requires higher efficiency, but more importantly, the construction of many more plants. We need builders as well as janitors. AI also plays a role here by improving reliability and revenue stability, which makes projects more bankable. Yield optimisation improves today’s plants; scaled deployment of AI helps make tomorrow’s plants investable.
The limits of AI and why they matter
Despite the hype, AI is no cure-all. It cannot compensate for poor plant design, chaotic feedstock contracts or maize projects optimised for subsidies rather than carbon intensity. Over-automation and black-box decision-making carry real risks, and it will be a while before most operator’s hand full control of their multi-million-pound biological baby to an algorithm.
There is also the issue of grid constraints, particularly for electricity plants. Increasing gas yields is pointless if you cannot squeeze the product into the grid. If the plant is grid-constrained and has a positive gate fee, there is actually no upside to increasing yields.
Notwithstanding these outliers, AI’s most interesting contribution to biomethane is making something that works work a little bit better. It offers incremental improvements, fewer bad days, less foaming, and a few more CI negative cubic metres injected from the same feedstocks.
Fixing the plumbing
This brings us back to that dodgy shower. The fix wasn’t revolutionary. There wasn’t a redesign and no new water source. It was just a matter of replacing a worn-out part and paying attention to a system everyone had taken for granted because it “sort of” worked.
Biomethane is much the same. The pipes exist. The gas grid exists. The feedstocks exist. The plants sort of work. AI helps the system stop rattling, stops plants wasting energy, and starts delivering the maximum theoretical gas yield day after day, cubic metre after cubic metre.
Sometimes, the most important work in the energy transition isn’t inventing something new. It’s tweaking the plumbing before everyone gives up on the shower.
As I begin my 61st year hurtling gently towards heaven, LEGO Technic remains stubbornly lodged on my Christmas wish list. There is something deeply…

As I begin my 61st year hurtling gently towards heaven, LEGO Technic remains stubbornly lodged on my Christmas wish list. There is something deeply therapeutic about spending my hungover Boxing Day assembling tiny, fiddly bits of plastic whilst my wife reflects ruefully on her life choices.
As an aside, every time I build something with wheels, I’m reminded that the world’s largest tyre manufacturer, by unit volume, isn’t Michelin, Bridgestone or Continental – it’s LEGO. They make over 300 million tyres a year, albeit very small ones.
This year, I was lucky enough to receive a LEGO tractor-and-trailer set, which inevitably set my mind wandering. Specifically, could we run European agriculture on biomethane instead of diesel? And if so, how much manure would that actually take?
So, my first blog of 2026 is an attempt to answer that question. Apologies in advance: we need to wade through a little maths first.
How much diesel does farming actually use?
European agriculture is spectacularly dependent on diesel. Tractors, combines, forage harvesters, irrigation pumps, grain dryers, if it moves, spins or rattles loudly in a field, it probably runs on red diesel.
Best estimates put on-farm agricultural diesel use at around 15 million tonnes per year across the EU. That excludes upstream inputs like fertiliser manufacture and downstream food transport; 15 million tons is just the fuel burned directly on farms.
Diesel contains about 11.9 MWh per tonne, so agriculture consumes roughly:
15 million tonnes × 11.9 MWh = ~180 TWh per year
That’s the target amount of energy we need.
How much biomethane from how many plants would we need?
Biomethane contains about 10 kWh per cubic metre. So, to replace 180 TWh of agricultural diesel, we’d need:
180 TWh ÷ 10 kWh/m³ = 18 billion m³ of biomethane per year
That’s a big number, but not an absurd one. Europe currently produces around 7 billion m³, so we’re talking about a 2.5× scale-up — not a moonshot, more a stiff climb.
A large modern biomethane plant might produce 40 million m³ per year, so:
18 billion ÷ 40 million ≈ 450 plants, so 18 billion m³ and 450 plants are our key numbers.
The obvious next question is whether Europe has enough feedstock to support them. Which brings us neatly to manure.
Cows first (because they always go first)
Europe has around 85 million cows. Each produces roughly 65 kg of manure per day, or 23 tonnes per year. That’s a lot of poo.
A tonne of cow manure yields around 13–16 m³ of biomethane, so assuming 14 m³/t as a mid-point, we get
322 m³ x 85 million equals 27 billion m³of biomethane, which is all we need.
The snag, of course, is collection. Manure is only easily captured when animals are housed, and cows don’t live in sheds all year. If we conservatively assume we can collect one-third of available manure, cows could still deliver 9 billion m³of biomethane, which is about ½ of what we need.
What about chickens?
Europe has around 1.8 billion chickens, which equates to just over four chickens per European. If chickens could vote, European politics would look very different.
Chickens are a bit like supermodels. They don’t want bloated stomachs because they still harbour delusions of flight and don’t want to feel weighed down by food (the chickens, not the supermodels). As a result, they extract less energy from what they eat and quickly pass the rest through. Which means their manure is still full of energy. (This probably applies to both)
Each chicken produces about 50 kg of manure per year, yielding roughly 2.75 m³ of biomethane per chicken per year. Individually unimpressive. Collectively not.
So, we have a three-part problem: many more chickens than cows, less manure per bird, but higher energy content. Using the same conservative one-third collection assumption as for cows, European chickens could contribute 1.6 billion m³.
NB: “Chickens with delusions of flying” would be an excellent name for an indie band.
Finally, the pigs
Europe has about 132 million pigs, each producing around 7 kg of manure per day. Pig manure has a slightly higher gas yield than cow manure, thanks to pigs having a less efficient digestive system. They don’t dream of flying, but they have only one stomach instead of four.
Europe has about 132 million pigs, each producing roughly 2.5 tonnes of manure per year (or 7 kg/day), with a biomethane yield around 20 m³/t, so 50 m³ per pig per year. Applying a collection of one-third and following the same maths, you get 132 million x 50m³ x 1/3rd equals 2.2 billion m³ per year.
Putting the numbers together
After all that arithmetic, here’s the payoff:
Total: ~12.8 billion m³ of biomethane
That’s 71% give or take of the 18 billion m³ required to replace all agricultural diesel use in Europe. We could probably source the remaining by increasing the amount of poo collected from 1/3rd to more like 40% or 50%.
What would that actually achieve?
If we could get to 18 billion m³, we could replace 15 million tonnes of diesel and avoid roughly:15 million × 3.2 tCO₂ = ~48 million tonnes of CO₂ per year.
And that’s before you account for the fact that manure-based biomethane often delivers net-negative emissions, because collecting manure and putting it into AD plants avoids methane that would otherwise leak into the atmosphere.
In climate terms, this is one of the highest-leverage interventions available to European agriculture. It’s obviously not as sexy as wind or solar, but in practical day-to-day terms, it is a very effective policy with an almost instantaneous payback in terms of avoided CO2.
Making it happen (the awkward bit)
The maths works. The physics works. Three challenges remain.
Collecting manure means housing animals — more sheds, more covered yards, more slurry management. In my experience of visiting farms, the cows, chickens and pigs don’t seem overly bothered about being kept in sheds out of the rain. City people, however, are.
Try saying this at a dinner party:
“I’ve been thinking we need to house more livestock to decarbonise European agriculture.”
Suddenly, it’s not Animal Farm, it’s 1984. Vegans get shouty. Hurtful things get said about foie gras. Your partner reminds you, once again, Michael, please don’t talk about your job at parties.
Roughly 450 biomethane plants at perhaps €40–50 million each, requiring between €20–25 billion of capital investment – that sounds large until you remember that Europe spends maybe EUR 400 billion annually on fossil fuel imports.
Infrastructure investors, meanwhile, have developed a remarkable fondness for biomethane, so this may be the least problematic hurdle.
Agriculture replaces machinery slowly. Tractors last decades, not years. But gas-ready engines already exist for heavy-duty applications, and many stationary uses, such as grain drying, irrigation pumping, and on-farm CHP, can switch far faster than a mobile kit.
This is less a chicken-and-egg problem than a tractor-and-tank one. If fuel is available, equipment follows. If it isn’t, it won’t.
Conclusion
It is technically feasible to replace all agricultural diesel use in Europe with biomethane produced largely from livestock manure. The feedstock exists. The technology exists. The emissions savings are enormous.
The main resistance isn’t engineering -it’s aesthetics, politics, and dinner-party acceptability. The main pushback is animal housing, so you can collect the manure, but we already do much of this; we just don’t mention it to people who live in cities and go to dinner parties.
My LEGO tractor will never plough a field and will spend its retirement gathering dust in my home office. But in the real world, its biomethane-powered cousin could quietly remove 15 million tonnes of CO₂ from European agriculture, powered, improbably, by cows, chickens, pigs, and a great deal of poo.
Only a few steps from the Green Giraffe Advisory office in Hamburg, energy ministers, TSOs and the offshore wind industry gathered yesterday to talk…
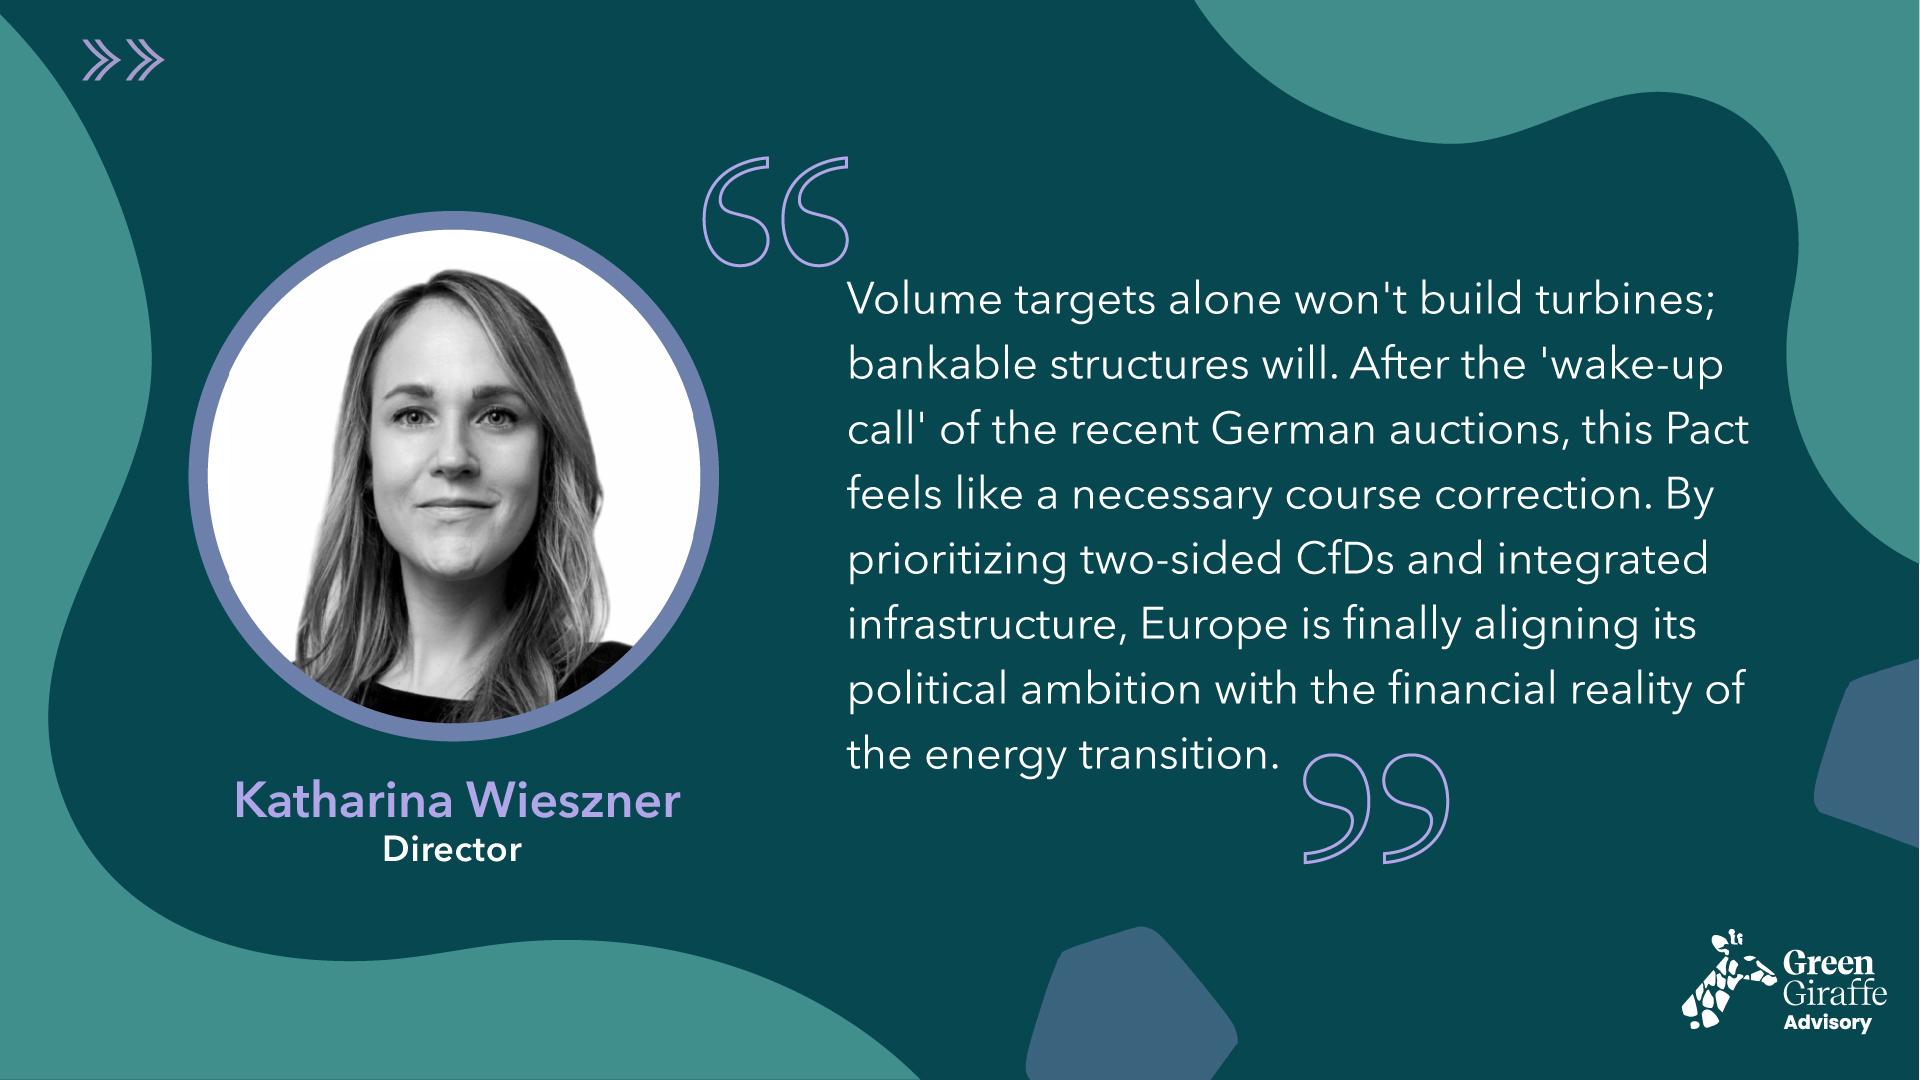
Only a few steps from the Green Giraffe Advisory office in Hamburg, energy ministers, TSOs and the offshore wind industry gathered yesterday to talk energy security.
What a happy January: AR7, the Hamburg Declaration, and a flying start to 2026 for offshore wind in Europe.
The North Sea Summit on 26 January was about far more than offshore wind targets. It was a deliberate political signal from the North Sea countries, including the UK, Germany, the Netherlands, Belgium, France, Denmark, Ireland, Norway and Luxembourg, that clean energy is now inseparable from security, resilience and industrial policy.
Yes, the headlines focus on the Investment Pact for the North Seas and the commitment to 15 GW of offshore wind per year from 2031. But for those of us watching the market closely, the mechanism matters far more than the volume.
Last summer, in my blog post, I described Germany’s offshore wind auction outcomes as a “loud and clear wake-up call.” Uncapped negative bidding and high merchant exposure had pushed the sector to its limit. The conclusion was simple: if political ambition is to translate into delivered projects, the offshore wind market needs to evolve beyond a pure “pay-to-play” model. System stability and efficiency will need to be ensured.
From that perspective, Hamburg felt like a moment of recognition. After years of Green Giraffe Advisory advocating for the stability of CfDs (Offshore wind – Auction designs and why PPAs are only second best), the industry’s core arguments have finally moved from the fringes to the centre of policy design.
Have all the industry voices finally been heard?
It seems that the key arguments have finally been heard. To achieve energy independence, we need to utilise the energy resources available to us and scale up production quickly. It can be done; China reached 50 GW within only a few years.
Three takeaways
The renewed political commitment to two-sided Contracts for Difference and support for bankable PPAs is the most important signal from Hamburg. Following the recent German auction experience, the appetite for pure merchant risk or heavy concession payments appears to have diminished. This pact suggests a shift toward delivery-driven market design.
The focus on cross-border “hybrid” projects, shared TSO principles, and coordinated grid expansion reflects what is now unavoidable: system integration is a prerequisite for bankability. Managing volume risk, negative price hours and grid curtailment cannot be solved project-by-project. It requires coordinated infrastructure planning at scale.
A 15 GW/year build-out and ambitions to reduce costs by 30% will only happen if the supply chain and investors believe the framework is credible. That means early-stage financial structuring that allows developers and suppliers to commit capital to vessels, steel, ports, factories and people to expand capacity. If this is not done, key bottlenecks remain, and prices remain high. The sector needs strong commitments and not just targets.
Why this matters
The North Sea is where offshore wind proved it could scale. Hamburg was an acknowledgement that the next phase of growth requires more sophisticated risk-sharing, stronger government involvement, long-term support and greater reliability in market frameworks.
For advisors, lenders and developers alike, the task now is to turn political momentum into bankable, investable projects – a mission Green Giraffe Advisory is proud to support: https://www.linkedin.com/feed/update/urn:li:activity:7393638401897500673
What matters next is implementation
These are exactly the questions we are working through with clients, and we are more than happy to discuss them.
One thing is clear: If Hamburg is followed by consistent policy delivery, this could mark the point where ambition and reality finally start moving in sync again.
Turns out the internet widely considers the ending of Monty Python’s The Holy Grail to be one of popular cinema’s most famous anticlimaxes. As King Arthur readies his army to charge his French nemeses hiding…
Turns out the internet widely considers the ending of Monty Python’s The Holy Grail to be one of popular cinema’s most famous anticlimaxes. As King Arthur readies his army to charge his French nemeses hiding in the castle of Camelot (actually called the Castle of Argh), several modern-day police cars suddenly turn up with loud sirens. After having previously taken in Lancelot, the police now also arrest Arthur for the alleged murder of Frank, the “famous historian” turned narrator.
As Arthur is carried off the battlefield, police officers crowd-manage his army with megaphones, the film crew is told to stop recording (“All right, that’s enough”), and the movie abruptly ends. Pretty funny, at least in my view.
Coincidentally, I discovered the online consensus about this being a famous anticlimax around the same time when the outgoing Dutch Minister of Climate and Green Growth, Sophie Hermans, announced the budget for the upcoming 2026 Dutch offshore wind auction. Though there are still a lot of uncertainties around the structure of the support scheme and the impact of the recent Dutch elections, as it currently stands, the government has reserved an amount of EUR 948.3 M for 2 GW of capacity for the upcoming auction. Sounds like a lot of money. But if you take a closer look, will it live up to expectations? Or is Hermans’ budget running the risk of becoming an anticlimax for offshore wind?
If you want to form a sensible view on this, you need to look at the revenue line an offshore wind farm needs to be successfully financed, built and operated and compare that to the price of electricity an operator can obtain in the market. As both are typically expressed in EUR/MWh, let’s first convert Hermans’ budget into something comparable. The table below illustrates at the highest possible level what the budget gets you for an “average” 2 GW offshore wind farm, over an assumed pay-out period of 15 years (in line with the Dutch SDE++ support scheme).
Table 1: Hermans’ offshore wind budget in EUR/MWh, assuming a 15-year support payout period
| Item | Value | |
| Capacity | = (a) | 2 GW |
| Typical P50 net capacity factor | = (b) | 45% |
| Hours in a year | = (c) | 8.760 hours |
| P50 annual production | = (d) = (a)*(b)*(c) | 7.884 GWh |
| P50 production over 15 years | = (e) = (d)*15 | 118.260 GWh |
| Total government support budget | = (f) | EUR 948.300.000,00 |
| Annual support per MWh over 15 years | = (g) = (f) / (e) / 1000 | 8.02 EUR/MWh |
Normalising recent tender results from France (September 2025) and Ireland (November 2025) with broad brush strokes shows that the winning bidders assumed a nominal revenue level between 75 and 90 EUR/MWh over 20 years to make their business cases work. Applying auction results from other jurisdictions to our Dutch case is obviously a simplification. The exact level will be driven by project factors (such as site-specific water depth, soil conditions, wind speeds, risk profile, etc.) and hence needs to be determined bottom-up based on a lot of variables. However, for the purpose of this post, let’s assume for argument’s sake that our Dutch wind farm can make do with the simple mid-point, i.e. 82.50 EUR/MWh paid out over the 15-year SDE++ period.
Now let’s look at Dutch electricity price projections, an equally tricky topic. In the absence of a public long–term power price forecast, one could look to the Dutch forward electricity prices, which trade up to four years in the future, to at least get a sneak peek of how the market sees the near term. Note that these futures concern baseload power and therefore need to be corrected for offshore wind capture rates to take into account profile losses and approximate the average price an offshore wind farm would manage to obtain. The Netherlands Environmental Assessment Agency (PBL) recently calculated the capture rate to be around 80% for 2024. Assuming this rate stays constant over time, an indicative proxy for offshore wind-specific forward prices for the coming four years can be computed as per the table below (i)
Table 2: forward prices (baseload and offshore specific)
| Prices in EUR/MWh | 2026 | 2027 | 2028 | 2029 |
| Average 2025 forward price (nominal) | 87 | 80 | 75 | 73 |
| Net of 80% capture rates | 70 | 64 | 60 | 58 |
The obvious question is: what happens beyond 2029? The above table shows a downward trend even before applying the profile losses. These losses are expected to increase as the build-out of turbines at sea continues, further suppressing the price wind farms can capture. At the same time, one could argue that at some point, electricity prices are bound to rise due to the electrification of society and the increase in electricity storage possibilities, at least partially offsetting this effect. For this analysis, we suggest simply assuming the long-term electricity capture price for offshore wind stays at the level of the 2029 forward (albeit corrected for further inflation beyond 2029).
So, what happens when we put this all together? The graph below plots our required 82.50 EUR/MWh, along with our long-term electricity price proxy (corrected for 2% inflation post-2029). The turquoise columns highlight the delta (financial gap) between the two as of 2031 (the assumed generation start date for the wind farm to be tendered).

Figure 2: Required revenue versus electricity price proxy
As can be seen from the graph, the required revenue line sits above the assumed forward price, implying government support is needed to make the business case work. Furthermore, the delta exceeds the 8.02 EUR/MWh top-up calculated in Table 1 for pretty much the entire 15-year period. In fact, if you were to goal seek for the additional budget needed to plug the gap between the two, an additional amount of ~EUR 535 M would be needed.
Our project could look to the market for support, and see if it can sell its offtake at a premium to (corporate) offtakers. In fact, this has been the government’s strategy for years. However, the combination of an increased cost base following the Ukraine crisis and the lagging demand for green electrons from industry has proven that this is a risky bet in the current context, with various failed auctions across Europe (including recently in the Netherlands). And the lower Hermans’ support budget, the bigger this bet becomes.
Of course, this analysis is simplified and takes some notable shortcuts. However, the objective is to show that the current budget is not sized to comfortably derisk the next Dutch offshore wind auction. Keep in mind that investors must factor in a wide range of uncertainties and will assess the impact of different scenarios on the available budget. To illustrate this:
Any sensible investor will realise that the relative impact of fairly small changes in assumptions is huge.
Some further browsing on The Holy Grail revealed that the movie’s ending was actually born out of necessity: there was insufficient budget for an epic final battle (which is actually quite ironic in the context of this blog!). As the Pythons pondered their pecuniary position, they opted for a pragmatic solution that also made artistic sense. It could be that, in hindsight, Minister Hermans’ budget sizing turns out to be spot on. However, due to the importance of the sector for Dutch energy independence, job creation and climate objectives, it seems better to reserve a healthier budget now to ensure sufficient auction participation and avoid the anticlimax of another failed tender.
________________________________________________________________________________
(i) For the capture rates, see PBL report 31 October 2025, page 5. For the forward prices, data is collected by Onno Toepoel at Zicht op energie (table shows 2025 average forward values, accessed on 16 December 2025) from the ICE Endex
(ii) The effect is not symmetrical with the impact in changing the revenue topline due to the inflation applied to the electricity price (while the top line is assumed nominal). Also, to note, the impact of +1/-1 EUR/MWh result is in fact not fully symmetrical either, as the electricity price breaches the strike price towards the back end of the support period in case you assume the electricity price to be increased by 1 EUR/MWh (and hence no support is paid out). Either increasing the base case strike price or lowering the electricity price assumption would restore the symmetry
I used to be a vinyl nerd. My angsty teenage self hoarded hundreds of scratched LPs in faded sleeves, and they’ve sat unplayed on…
I used to be a vinyl nerd. My angsty teenage self hoarded hundreds of scratched LPs in faded sleeves, and they’ve sat unplayed on my shelves for decades because my turntable was also 40 years old. Then, someone invented the smart turntable: digital conversion, auto-levelling, and other technical wizardry I don’t pretend to understand. Suddenly, the whole collection had a second life, no more skipping, no more ‘underwater sound’. The old obsolescent kit was reinvented by bolting on something new and clever.
You see the same pattern everywhere. The bicycle becomes an e-bike. Mechanical watches morph into smartwatches. Dusty Victorian novels find new purpose as audiobooks are read by breathy actors between gigs. The theme is consistent; infrastructure that looked obsolete becomes valuable again once technology catches up to repurpose it.
European biogas plants are the energy-sector equivalent of those vinyl records. Across the continent, 20,000 or so plants happily digest organic waste, manure and food residues into raw biogas (CH₄ + CO₂) and burn it in engines to make electricity. Most were built a decade ago under generous feed-in tariffs or CHP schemes, Germany’s EEG, Italy’s Conto Energia, France’s FITs, and Denmark’s incentives – all designed to reward electrons, not molecules. As those schemes come to an end, the economics stop working, and the plants end up quietly rusting away in the farmyard.
Why retrofitting upgraders makes sense
Fast-forward to the 2020s, and the market has flipped. With wind and solar now commonplace, Europe frequently has too many electrons in some regions and too few gas molecules in others. We solve this with something of a contradiction: we pay wind and solar developers not to generate electrons on windy, sunny days, but then import methane molecules from Russia and Qatar pretty much every other day.
The obvious opportunity is to stop turning molecules into electrons, and that’s where our analogy of old vinyl comes in: we can bolt on technology to make the transition. The two key things here are the language and chemistry of biogas (a chemical mixture of CO₂ and CH₄) and biomethane (CH₄). People often use these words interchangeably, which drives me mad, but for our purposes, the semantical distinction is critical.
Biogas can be burned in engines, but biomethane entering the grid must be pure CH₄, so it needs to be purified to remove the CO₂. Thankfully, Mother Nature has helpfully made oxygen molecules much larger than hydrogen ones, so a CO₂ molecule is approximately three times larger than a CH₄ one. Upgraders can separate the two gases by using membrane technology, whereby the little CH₄ molecules go through the holes, and their bigger CO₂ cousins stay stuck on the other side. Similar physics applies when lithe young men can squeeze into the driving seats of low-slung sports cars, but let’s say sturdier middle-aged blokes like me can’t.
Membrane technology is proven, modular and widely available, but the real kicker is this: thanks to legacy tariff schemes, all the expensive infrastructure: reception halls, digesters, and feedstock systems already exist. Retrofitting an upgrader to switch a site from electrons to molecules costs a fraction of building a new biomethane plant.
The emergence of upgrading technology is also cracking news for the original developer, typically a farmer. He/she will have built the plant on the back of the electricity tariff support, so probably didn’t expect a second bite of the revenue cherry. Consequently, owners of biogas plants that are coming to the end of tariff regimes tend to be quite amenable to incoming investors who can extend the life of their plant by another fifteen years.
How to upgrade your plant in five easy steps
While no two European biogas plants are quite alike, the retrofit process is surprisingly consistent:
These retrofits can be completed in 9–15 months, which is an awful lot quicker than building a plant from scratch.
The market potential is huge
As previously discussed, Europe’s biomethane landscape is expanding rapidly:
Why investors like upgraders
For infrastructure funds, retrofitting gas upgraders to existing biogas plants is firmly in the ‘sounds like a plan’ box because it offers:
Returns can be surprisingly strong because you’re leveraging existing capex instead of building everything from scratch.
Turning redundant plants into a EUR 10 billion opportunity
Just as my smart turntable revived my vinyl collection, retrofitting Europe’s legacy of biogas plants could turn a rusting asset base into a major plank of energy security. With circa 20,000 plants already on the ground, a €10 billion opportunity to upgrade them from electrons to molecules is sitting in plain sight. My records didn’t die; they simply waited for the right technology to bring them back to life. Europe’s biogas sector can enjoy the same Lazarus-like revival, not through endless new construction, but by upgrading what we already have.
My wife is an aspiring politician, so I’ve spent a fair few evenings at social events balancing canapés and conversation with ministers and prime…
My wife is an aspiring politician, so I’ve spent a fair few evenings at social events balancing canapés and conversation with ministers and prime ministers. What strikes me every time is how genuinely frustrated they are. They pull a legislative lever in Westminster, Brussels, or Rome, expecting instant results, and nothing happens. Or worse, something happens glacially slowly, and the next Government gets the credit.
This disconnect between policy lever and action is especially apparent in renewables. To build anything anywhere, you need planners, developers, builders, investors, and banks all to align in some form of a celestial constellation of actors. This can take years. And sometimes, the stars refuse to line up despite how hard you pull the lever.
Tidal energy is a classic example of this. Every politician who is interested in renewables looks wistfully at the North Sea and thinks that huge mass of water being dragged back and forth every day by the moon must be a source of energy. At a rough estimate, about a trillion tonnes of water is moved with every tide. As a result, we have had decades of ministerial enthusiasm, glossy strategy documents, and generous subsidies, but what we have is a black hole rather than a constellation because investors and banks still won’t go near the sector.
Last week, sitting in the echoey grandeur of the European Biogas Conference, I was reminded of this disconnect. There were drinks receptions, expensive trade stands, and the politicians were all super bullish: “Europe will scale biomethane production fivefold by 2030!” but I looked around the hall and noticed how few banks were actually there. You can have all the policy ambition you like, but without finance, it’s just lofty pronouncements echoing around a hall full of other politicians and slightly hungover financial advisors.
Europe consumes approximately 350 billion cubic metres (bcm) of gas per year, and this is nearly all imported. The Russian invasion of Ukraine has made energy security very much today’s special on the European policy menu. The most popular session at the conference wasn’t about biogas technology or feedstock logistics- it was a talk by a NATO general.
To try and reduce reliance on imports, European leaders have agreed on a biomethane target of 35 billion cubic metres (bcm) per year by 2030. Current production is about 7 bcm. You can do the maths: that leaves a gap of 28 bcm. This equates to roughly 560 large-scale plants, each producing 50 million cubic metres per annum, needing to be built in the next five years.
There are 1,862 days until 31 December 2030. That means a new biogas plant has to come online somewhere in Europe every four days.
Each large plant costs around EUR 50 million. Therefore, 560 plants require EUR 28 billion of capital — approximately EUR 19.6 billion of debt and EUR 7 billion of equity. Following the same maths, this requires an investment of EUR 50 million every four days, all to be invested before the 2030 deadline.
Across Europe, different politicians from different countries are dangling different worms to lure in this money to decarbonise their gas systems and reduce their own reliance on energy security:
But support mechanisms will only get you so far. Banks and investors are now spoiled for choice, and they will go where projects are clean, clear, and creditworthy.
Bankers want to be bored by your project. No alarms and no surprises. It should be like every other biogas project they have ever funded, with the same five things every time:
Remember: this is a pan-European competition. If your feedstock or certificate story is weak, another developer somewhere else will have a stronger one, and that’s where the bank’s money will go. There’s no God-given decree that says somebody has to fund your project.
Pretty much every new client will ask me what the typical terms for bank debt are, and my answer is always, “well, that depends”. That doesn’t make for a very interesting blog, so I am going to stick my head above the parapet and say this is roughly what you can expect.
| Term | Typical Range | Commentary |
| Loan Tenor | 12–15 years | Often with a cash sweep after year 10 |
| Gearing | 70–75% | Higher only with rock-solid feedstock and revenue contracts. My personal best is 82% |
| DSCR | 1.25–1.35x | Higher if there’s merchant exposure |
| Interest Spread | 200–250 bps over Euribor | More expensive than wind but not crazy considering the risk |
| EPC | Preferred but not essential | Banks like experienced developers with a proven track record of building biogas plants, not just “solar installers having a go” |
| Feedstock Contracts | Long-term | The foundation for everything else in the deal |
| Revenue | Semi-fixed | Gas can be unhedged, but certificates need a floor price to count |
Europe’s biogas sector stands at the start of a decisive five years. Energy security is now driving the transition to biogas and thanks to the Russians, this initiative commands significantly more political support than Net Zero targets. As winter approaches, getting even 10% of gas from within Europe seems like a good idea.
To get there, we need to invest EUR 28 billion in 1,862 days, which is a huge challenge and requires an awful lot of bankers and infrastructure funds to get on board quickly. Politicians may make lofty speeches, but the reality of building 560 plants takes shape in business cases, dreary credit committees and densely worded feedstock contracts.
And if we drill down from 560 plants to just a handful, the requirements remain the same: feedstock, proven technology and at least a degree of contracted revenues. If you can supply these somebody somewhere will fund your project on the terms set out above. If you can’t, then they won’t.
Mrs. Ware has lost the last three elections she stood in, but she keeps going pounding the streets and knocking on doors because she believes that she can make a difference.
Her only real expense is printing leaflets and a new pair of comfortable shoes each election. We can make a difference with biogas in Europe, but unlike her, we can’t do it alone – we need the bankers and infrastructure fund to join the party. They are willing, but only if your project is really, really boring. We need to move on from lofty announcements to shovels in the ground, so hopefully there will be a lot more bankers and fewer politicians at the next biogas conference I go to.
One of the lesser-known facts about the Titanic is that it sailed without the key to the lookout’s binocular cupboard because a crew member,…

One of the lesser-known facts about the Titanic is that it sailed without the key to the lookout’s binocular cupboard because a crew member, David Blair, had unexpectedly left the ship in Southampton with the key still in his jacket pocket. The ship set off into the Atlantic, the lookouts couldn’t see very far ahead, and that’s how Kate Winslet ended up hogging that big door all to herself in a freezing sea.
Today’s shipping industry has, of course, radar instead of sailors in crow’s nests, but it risks the same mistake: failing to see big things looming on the horizon. The iceberg this time is carbon emissions.
In 2022, international shipping burned about 300 million tonnes of fuel and produced over a billion tonnes of CO₂, or around 3% of global emissions. Regulators and customers alike are pressing hard for reductions, and the threat of legislation to cap emissions is very real. Everyone in shipping knows they must change course, but the debate keeps circling back to one word: fuel.
Big ships and big numbers
The problem with shipping is that everything is supersized, and so is the pollution.
A large container ship on a Europe-Asia run burns 60,000 tonnes of fuel a year which is roughly the energy use of a small city, or what you’d need if Milton Keynes suddenly decided to sail to Shanghai.
A single container ship emits about 300,000 tonnes of CO₂ a year, so if we imposed a carbon tax at EUR 80 per tonne of carbon that’s EUR 24 million per year, per ship.
This is why shipowners view “carbon taxes” the way most of us view tax increases for public spending: good in theory, but ideally someone else pays.
The threat of emissions trading
However, despite industry protests, the EU has already extended its Emissions Trading Scheme (ETS) to cover intra-EU shipping. For now, transatlantic and transpacific voyages remain outside the scope. But “for now” is doing a lot of the heavy lifting in that sentence. Almost everyone believes broader restrictions on the emissions created by pan-Atlantic and pan-Pacific routes are only a matter of time, which is why shipowners are urgently exploring alternatives to heavy fuel oil.
What about electrification?
It is not really an option. A few short ferry routes run on batteries, but the physics of energy density per kg kills the idea for long-haul shipping. One tonne of fuel oil has 4.5 MWh of energy, which is the same as a battery weighing 25 tonnes. A transatlantic voyage that consumes 3,000 tonnes of fuel oil in 15 days would need 67,500 tonnes of batteries because they can’t be recharged at sea. Unless we plan to build ships that sink under the weight of their own power supply, batteries are out of the picture.
Liquified Natural Gas (LNG) as a stepping stone
This brings us nicely to LNG. There are now 400+ LNG-fuelled ships afloat and another 500 on order. LNG cuts CO₂ emissions by about 20% compared to heavy fuel oil and eliminates most SOx and particulates. It is a step in the right direction, albeit a little one.
But LNG is still methane, and this brings us nicely to the concept of ‘methane slip’. This sounds like the sort of grunge band your moody teenage kid likes but actually refers to the 1–3% of methane that escapes unburned from the engines in the exhaust. This means that by burning LNG, we are actually putting a little bit of methane into the atmosphere, somewhat undermining the benefit. As an aside I once had a ‘chunky’ friend who went on a diet plan, faithfully ate all the prescribed salads and fruits, but slightly misunderstood the instructions and continued his usual intake of beer, pies and cakes as well. Technically he was “on the diet plan,” but the overall effect? Negligible. That’s methane slip, it’s better than the emissions from heavy oil, but like my friend’s unorthodox approach to dieting, the overall climate benefit is severely diminished.
That said, LNG’s real value is in building bunkering infrastructure. Over 200 ports now offer LNG bunkering, and every one of them can handle bio-LNG with no changes. That’s like having a universal phone charger, rare, useful, and worth investing in.
Enter bio-LNG
Bio-LNG is simply biomethane (from manure, food waste, sewage, agricultural residues) that has been liquefied. Chemically, it’s identical to LNG, the molecules don’t know or don’t care whether they came from a cow or a gas field.
The problem is twofold: lack of supply and cost. Global biomethane production is around 95 TWH per year, versus shipping’s demand of 10,000 TWh/year. That’s just 0.95% and only if all biomethane went into ships.
Cost is the other hurdle. Fossil LNG trades at $400–600/tonne; bio-LNG at $1,500–3,000/tonne. A 20,000 TEU container ship burning 200 tonnes/day would add $200,000/day in fuel costs if it ran on bio-LNG alone, so that’s why nobody is buying bio-LNG yet.
How this might change
Three things could tip the balance:
ETS expansion – As we discussed in a previous blog, biogas made from manure or waste has a negative CI score of around (50 Co2ge/MJ) compared to 80 90 Co2g e/MJ for natural LNG. This means that if a shipping owner burns Bio-LNG, they no longer have to buy carbon credits, they may actually be able to sell them. This is a big win and would go a very long way to offsetting the cost difference the two fuels, but only if the EU imposes a carbon tax on shipping.
Cargo-owner pressure – If big shippers like Amazon, IKEA, or Nike agree to pay a “green freight premium,” costs could be passed down the chain, though this idea may run into the same headwind of adverse public opinion facing the rest of the renewables industry. People are turning against green policies that impact their day-to-day budgets and are unlikely to swallow a hike in the cost of Nike trainers because of an emission tax on shipping.
Scale – The ongoing expansion of Europe’s biomethane expansion will increase supply and reduce costs but shipping will face strong competition from heating, transport, and industry for the same molecules. This is good news for investors in biogas of course.
The strategic value of optionality
For many shipowners, LNG is an insurance policy against looming regulations. They’re building 500 new ships that can run on fossil LNG today, bio-LNG tomorrow, and synthetic e-LNG (from green hydrogen and captured CO₂) in the 2030s. With ships lasting 25–30 years, that kind of flexibility is worth a lot.
Final thought
Neither LNG nor bio-LNG will be the whole of the answer. Neither gas can meet full demand, nor can they eliminate methane slip. But they can enable progress in building bunkering infrastructure, diversifying supply chains, and buying time.
The unsinkable Titanic’s maiden voyage lasted only five days before she sank. By anticipating the regulatory “icebergs” ahead and by investing in vessels capable of running on both fossil and renewable gas, the shipping industry can give itself a lot more time and flexibility to change course.
The other day, during a long car ride, I told my slightly bored teenage son that most shark victims had eaten ice cream in…
The other day, during a long car ride, I told my slightly bored teenage son that most shark victims had eaten ice cream in the hours before the attack. This, of course, is a classic example of correlation not causation. Shark attacks happen more when people are at the beach on hot days, and the victims tend to eat ice cream, then go swimming, hence the correlation. There is also a correlation between ice cream sales and lower electricity prices. The sun is the common factor. So demonstrably, there is both a positive and negative correlation between all three things: shark attacks, ice cream consumption (positive), and electricity prices (negative).
The relevance of this to renewable investing is, of course, the latter, the impact of hot weather on electricity prices. On Tuesday, 5 August 2025, a summer day, we saw the average UK day-ahead wholesale electricity price dramatically fall. It dropped from its normal range of GBP 54 MWh to GBP 76 MWh, a year-to-date low of GBP 16.79/MWh. This was mainly due to the unpredictable British weather; it was fairly sunny, and the country was still experiencing the effect of storm Floris, which had hit the mainland the previous day. Interestingly, the UK’s wind speed record for August was also set in Wick on that day when wind speeds reached 82 mph.
Earlier this year, during the May 2025 bank holiday, it was again warm and windy. Day-ahead wholesale prices dipped to GBP 52/MWh. However, this time with a one-off record low of minus (GBP 35.18) per megawatt-hour. That weekend, the National Grid ESO paid wind generators GBP 50 million not to produce due to capacity issues in Scotland. whilst solar output reached a record 14 GW, almost half of the total demand. There were no records of shark attacks, though.
This is all very interesting if you are a weather, shark, or ice cream nerd. But it also starkly illustrates the link between day-ahead pricing and the weather. This impact will get more pronounced as we add more weather-dependent capacity to the system.
The UK Contracts for Difference (CfD) regime protects some developers from these risks because the Treasury covers the shortfall between the day-ahead price and the CfD strike price. However, and here’s the nub of the issue: If the day-ahead market reference price is negative for six or more consecutive hours, the CfD won’t pay out during that period.
Furthermore, only around 18.5% of solar capacity in the UK has a CfD. The other 81.5% risk negative prices pretty much every day when it is simultaneously sunny and windy.
And days with negative hourly prices are increasing. In 2024, the UK recorded at least 149 hours of negative electricity prices. This is five times more than the 29 hours in 2022. Albeit most of these hours occurred in the middle of the night, driven by wind energy, not solar. In May 2025, the N2EX day-ahead power market experienced a record of 17 consecutive hours of negative pricing. This event tied the previous record set in July 2023.
We see this more starkly in Germany, where in the summer of 2025, Germany recorded negative prices in 345 out of 2,184 daylight hours. The lowest price during this time was minus (GBP 250.32/MWh), recorded between 1:00 PM and 2:00 PM on Sunday, 11th May. Also, around 28% of Germany’s solar generation in the first five months of 2025 happened when prices were negative. This is an increase from 18% during the same period in 2024.
And this is before we layer on growth. The UK currently has 20 GW of solar capacity. There’s a plan to reach 70 GW by 2035. This would require an investment of about GBP 30 billion based on 2025 prices. However, there are only 3 GW of batteries to time shift generation, so daytime summer supply will most likely triple within the next ten years, and this is invariably going to increase the number of days with negative pricing.
Stress-Test: What Negative Prices Do to IRRs and DSCRs
So, what does this mean for project economics and the bankability of a solar project?
Let’s take a typical 50 MW merchant solar farm in southern England and assume the following metrics:
This all sounds ok, 10% equity IRR is not fantastic, but it’s not a disaster, and the sun shines every day, so it is a pretty low-risk investment.
Now let’s layer in negative price scenarios as all that extra capacity starts to appear on the grid.
| Scenario | Negative hours | DSCR (x) | Equity IRR (%) | Commentary |
| Base Case | 0 | 1.2 | 10% | Financeable, tight but bankable |
| Low (5% lost) | 48 | 1.12 | 9.13% | Barely moves the needle on equity, but our bankers are now slightly worried when he/she is watching the weather forecast |
| Moderate (10% lost) | 96 | 1.05 | 8.16% | Now into cash sweep and default territory. Bankers are very alarmed by upbeat predictions of more hot and windy days to come |
| Severe (15% lost) | 144 | 0.98 | 9.62% | SPV in default, bankers are in tears |
| Extreme (20% lost) | 192 | 0.91 | 61.0% | Debt is unsustainable, SPV in administration, bankers lose jobs |
This is why lenders are twitchy about negative price risk. Projects with low levels of gearing at 65% are still at risk. Negative prices can lead to revenue loss. Even 144 hours, or about two weeks in summer, can drop DSCR ratios below 1. As we saw above, Germany had 345 hours of negative prices in summer 2025. So, 144 hours in the UK seems possible, especially if we triple the amount of installed solar capacity.
How to mitigate this (apart from not going into the water)
This is scary stuff for solar investors, but the more canny are learning to structure the risk.
In conclusion, shark attacks in the UK are pretty rare. Someone got bitten in 2022, but they were actively putting bait into the water to try and attract sharks whilst simultaneously snorkelling. So, you can’t legislate for stupidity. Negative prices are also rare but unfortunately increasing. Banks remain strong supporters of UK solar. However, I suspect the issue of negative pricing is now showing up in some risk assessments. If the UK succeeds in tripling its solar capacity from 20 GW to 70 GW, the number of daytime negative hours will inevitably increase, but this just may act as a self-regulating brake on installation.
My theory is simple: When negative daytime prices in summer exceed 100, new standalone solar projects probably become unbankable. This means the rate of increase in capacity will diminish, and the number of negative hours will plateau around 100. Existing projects may be able to survive, but they’ll face tighter cover ratios and lower returns. It’s unclear how many GW of extra capacity will trigger this 100-hour inflexion point. But it will likely be far less than 70 GW unless demand radically increases. The risk is that the government’s solar target might not be met. This could happen if no new projects get funding after hitting the 100-hour negative price point. My best estimate is that the market can absorb perhaps another 10 GW before negative prices really start to inhibit investment, but that’s just a guess.
This trigger point could be mitigated by amending the CFD regulations to compensate solar farms for negative prices. This is technically achievable, but getting public support for compensating generators during negative prices will be much harder. Without that support, it’s hard to see how GBP 30 billion in new capacity gets funded. We can confidently say that shark attacks in UK waters will stay rare. However, we are far less certain that 70 GW of solar will eventually be developed on the land.
When people think of Spain and renewable energy, they likely picture seas of solar in Castilla-La Mancha and Andalucía or wind turbines lording over…
When people think of Spain and renewable energy, they likely picture seas of solar in Castilla-La Mancha and Andalucía or wind turbines lording over Galician hillsides and the Ebro Valley in Aragon. If they are an energy nerd, they might even think about blackout or frequency variations. But that said, even the nerdiest of the nerds probably don’t think about methane, although Spain may well be the sleeping giant of the European biomethane boom.
Buried treasure in the dung heap
Let’s start with some properly intoxicating stats about biogas. According to Sedigas and the European Biogas Association:
And yet, as of early 2024, Spain had just 20 operational biomethane plants. France has over 500, Germany has more than 1,300, and even Denmark produces 30 times more biomethane per capita than Spain.
Here’s our favourite killer fact about biogas in Spain: one single facility, Valdemingómez in Madrid, produces 72% of all biomethane in Spain. A one-plant-wonder in a country bursting with bio-opportunity.
Spain’s animal kingdom
Spain is not short of raw materials. On any given hot sunny day, it is home to:
We like to think of this as an enormous, pungent, noisy zoo, but in reality, of course, these animals are dispersed throughout the country in big sheds. This huge herd of livestock means Spain is among the top four manure producers in Europe, generating 118 million tonnes of livestock manure and slurry every year, plus an easily 20 million tonnes of agricultural residue and 8 million tonnes of food waste.
That’s well over 100 million tonnes of feedstock per year, so you would think the Spanish would be busy collecting it all together in those big sheds, building biogas plants, and cheerfully selling renewable green gas guarantees of origin (RGGOs) to the German industrials. You would think all these things, but you’d be wrong.
Still Ill: Why is biogas stuck in Spain?
In a word, it’s bureaucracy.
Building a biogas plant in Spain is very hard, if not impossible. Planning and permitting routinely take 2–3 years, sometimes 5. The grid access process is opaque, patchy, and heavily skewed toward incumbents. If you don’t already have a gas pipeline running through your land, you’re probably out of luck.
Spain’s equivalent of green gas certificates only launched in 2023, and it is still not easy to export these.
Taking in aggregate, these things make biogas in Spain very hard. You need lawyers, lobbyists, and the kind of inner calm normally found in Buddhist monasteries.
Given this, it’s no surprise investors have looked to the likes of Germany and the UK. The skies aren’t as blue, there is more beer and less sangria, and the sea is a bit colder, but building a plant in Macclesfield is somehow easier than doing it in Murcia.
That said, the tide may be turning. Building biogas plants elsewhere in Europe is also getting harder. Germany is now saturated with plants, and developers are competing for feedstock. The Netherlands has tightened digestate spreading rules, forcing trucks to export it all the way to Poland. The UK is still a contender, but planning is now almost as painful as in Spain, just with more rain. Pretty much everywhere, feedstock availability is becoming king, and because of that big metaphorical zoo, Spain has it in royal supply.
Spain wakes up: Roadmaps and TWh targets
The Spanish government is (finally) stirring. Under the PNIEC and the Biogas Roadmap, Spain now targets 20 TWh/year of biomethane by 2030, which, to paraphrase Neil Armstrong, is a small step up from the previous 10 TWh draft and one giant leap from the current paltry 0.5 TWh/year.
Private players are also on the move:
Interestingly, the biggest driver to invest in biogas in Spain may be policies implemented in France and the Netherlands. Both these countries have recently introduced biogas blending obligations whereby gas suppliers have to “blend” a percentage of biogas into their mix. This decree originally underpinned many biogas business cases in these countries, but the helpful politicians in Brussels declared that imported biogas should be allowed to count against the obligation. So now, if you inject biogas into the grid in Spain, a Dutch gas company can buy those molecules and claim them against their blending requirement. Suddenly, business cases for biogas in Spain became more interesting.
Final thoughts: Becoming strong at the broken places
In the sprint toward Net Zero, biogas is probably Spain’s most underused, overripe opportunity. It’s local, circular, and could potentially be huge. It has taken time, but patience should be paying off soon.
Miguel de Cervantes, the Spanish writer widely regarded as the most important figure in Spanish literature, wrote:
“Trust in time, which often gives sweet endings to many bitter difficulties.”
Spain’s depressed rural economy (with some regions infamously labelled as “la España vaciada” – “the emptied Spain”), its gas grid, and its climate policy have all been stretched and broken in the last decades. Biogas is one way to make them stronger right where they’ve been weakest. It doesn’t just reduce methane from farms or offset fossil gas imports; it creates rural jobs, fortifies the energy system, and offers a 24/7 made-in-Spain solution to the problem of European reliance on gas imports.
Biogas in Spain is finally happening. Maybe not as fast as we would like, but happening all the same. It is often said that a given technology or country is the ‘Cinderella of the renewables world’, but Cinderella actually went to the ball (albeit she didn’t have a ticket, so technically she was a gate crasher). For too long, Spanish biogas has been patiently waiting in the kitchen for a fairy godmother that never came, but she might just have entered stage left.
In August 2025, Germany held an offshore wind auction for two pre-assessed sites in the North Sea, N-10.1 and N-10.2, with a combined capacity…
In August 2025, Germany held an offshore wind auction for two pre-assessed sites in the North Sea, N-10.1 and N-10.2, with a combined capacity of 2.5 GW.
The result? Zero bids.
Are we surprised? Honestly, not really.
The bigger question wasn’t if this model would eventually stumble, but when. One thing is clear: this is a loud and clear wakeup call.
A quick look back: how did we get here?
To understand how Germany’s latest offshore wind auction ended with zero bids, it’s worth tracing the policy journey that got us here.
Germany entered the offshore wind era with high hopes. In 2017, the introduction of the Offshore Wind Energy Act (WindSeeG) marked a new phase of competitive tenders and early results were promising. The 2017 and 2018 auctions awarded 3.1 GW of capacity, with some projects bidding at zero. I still remember the wave of excitement and disbelief when EnBW and Orsted won sites back in 2017. It was a bold move, a first in Germany, and people were stunned: how did they pull that off?
For a deeper dive into this aspect, I recommend the BWO interview with my colleague Udo Schneider with the title: “2017 – Null Cent, große Wirkung: Wie ein Auktionsjahr die Offshore-Wind-Finanzierung änderte”: https://bwo-offshorewind.de/15-jahre-offshore-wind-in-deutschland-2017/
That headline “subsidy-free offshore wind” became a symbol of confidence in falling technology costs, strong investor appetite, and maturing markets.
By 2022, Germany had set ambitious targets: 30 GW of offshore wind capacity by 2030, scaling up to 40 GW by 2035 and 70 GW by 2045 as part of its broader strategy to decarbonize power generation and ensure energy security.
However, the design of the auction system changed in 2023 with the introduction of negative bidding. Under the new rules, if more than one developer submitted a zero-subsidy bid, they would enter negative bidding rounds and essentially pay the federal government for site access. Competition began to narrow, especially after that first 2023 auction, and the approach quickly drew sharp criticism from the industry. The model could work, but only if several assumptions held true: that technology and financing costs would keep falling, and that wholesale power prices would rise enough to keep projects profitable. At first, these assumptions seemed plausible. The 2023 round awarded 7 GW of capacity, with major players like BP and TotalEnergies committing over EUR 12 bn in concession payments (up to EUR 1.8 M per MW). The message seemed clear: the market was still willing to bet big.
In 2024, the momentum appeared to continue and 8 GW of capacity was awarded across two tender rounds, though the field of participants narrowed further. Bids remained high, with developers such as TotalEnergies and EnBW committing more than EUR 1 bn per project.
Then came 2025: in the first auction round, only two bidders participated. In the second round: none at all.
So why did the 2025 auction fail?
While the two auctioned sites, N‑10.1 and N‑10.2, came with their own technical challenges (deep water, uncertain grid connection timelines), the reasons behind the lack of bids go well beyond location-specific issues.
It reflects a widening gap between project risks and expected returns. Higher capital costs and capture price forecasts falling short of earlier expectations have made it increasingly difficult to model long-term project economics with confidence. Capex remains high, also because of a lack of competition on the turbine supplier side. Even though the expectation remains that parts of the supply chain will eventually stabilise, especially as fewer projects move forward globally, developers are still left with high uncertainty around electricity price risk. This is particularly relevant in a market like Germany that experiences increasingly frequent negative price hours and where long-term corporate PPAs may no longer offer the terms developers need to secure low-cost financing and a viable business case.
In this environment, the negative bidding model in Germany may have made developers think twice. While it succeeded in raising significant proceeds in previous rounds (note: 90% of the concession payment will only be paid over time after the project reaches COD), it also increased financial pressure on developers and may have discouraged broader participation. The model relies on costs continuing to fall and on developers maintaining a high tolerance for risk. These are assumptions that don’t feel sustainable.
This isn’t so much a failure of ambition or a challenge to offshore wind’s role as a cornerstone of the energy transition. Rather, it is a signal that the market conditions have changed and a reminder that policy design must evolve to keep future auctions attractive to investors and to safeguard Germany’s energy security.
CfD to the rescue?
Unfortunately, the answer is not as easy as that. Two-sided Contracts for Difference (CfD) are a powerful tool. They reduce revenue volatility, lower cost of capital, and have proven effective in other markets. The industry has long championed CfDs and we have been fans too. But in Germany, the answer isn’t as simple as adopting a CfD and all problems would be solved. In a time when renewables are once again under intense public scrutiny, it’s crucial to design a system that benefits the public without increasing the burden on taxpayers. Any remuneration model must ensure that renewable electricity is integrated into the broader power market in a cost-efficient and reliable way.
Renewable generation carries both volume risk and price risk. When large amounts of wind or solar electrons hit the grid at the same time and beyond demand, their value drops. This is especially evident during high-wind periods when every wind farm is generating at full capacity, driving down market value.
It’s understandable that the state can’t compensate at all times. Doing so would undermine market efficiency and could create severe system inefficiencies. On the flip side, leaving all the risk with developers drives up financing costs, as investors price in uncertainty, putting further pressure on project economics. Over time, this could undermine investors’ appetite and in turn, jeopardise the pace of the energy transition.
The questions are complex but unavoidable:
What now? Some food for thought
Germany has committed to 30 GW of offshore wind by 2030. That’s not a distant target – that’s five years away. Can we get there without reform? Could a shift to CfDs restore investor confidence? And if so, how should they be structured to ensure both system stability and efficiency?
This isn’t just about one failed auction. It’s a moment of truth for Germany’s energy transition, industrial competitiveness, and climate goals.
The spotlight is now on Berlin: the choices made in the coming months will determine whether this setback becomes a costly pause or the beginning of a much-needed shift toward a smarter, more stable policy framework.
Any redesign will also have consequences for projects awarded in recent years, many of which remain exposed to negative price risks. The challenge will be to create a new remuneration system that supports future investment without penalising those already in development.
We at Green Giraffe Advisory will be following the policy debate closely and stand ready to contribute, as its outcome will shape not only the next auction round and the future of Germany’s energy transition, but also the business cases of our clients. Stay tuned.
In 2005, I was unexpectedly single. My then-wife had run off with her homeopath, and I ‘celebrated’ my 40th birthday by going to a…
In 2005, I was unexpectedly single. My then-wife had run off with her homeopath, and I ‘celebrated’ my 40th birthday by going to a football match on my own and watched my team lose 1-0 in the rain. It’s now 2025, I’m married again, I have five kids, and my team has just won the league. Life can turn around a lot faster than you’d think.
In the same way, in 2005, the UK had 4 MW of installed renewable energy capacity. The biggest wind turbine on the market was around 4.5 MW, and a megawatt of solar PV cost GBP 5 million. While I was busy making and then parenting a lot of children, others were more usefully spending their time installing generation capacity. Fast forward to today: the UK now has 70,000 MW of capacity, the largest wind turbine in the world is 15 MW, and solar is down to around GBP 750k/MW. Not shabby really. Because things move quickly in energy, the National Energy System Operator (NESO) published their annual Future Energy Scenarios (FES) report. A 170-page, 1kg document laying out how our system might evolve over the next 25 years.
So, what do these 170 densely typed pages tell us? Where are we heading? And will we actually get there by 2050?
The 12-box matrix
The report is structured around four core policy areas:
The report then breaks this down into four “waves,” so we end up with four policy areas across four waves: 16 boxes in total. But since we’ve already lived through the first wave, we’re effectively dealing with 12.
The four waves
The report also outlines four different routes to the 2050 summit:
So: 4 policies x 3 waves x 4 scenarios = 48 possible futures. Hopefully that’s clear.
Renewable deployment: the real numbers
It is easy to poke gentle fun at how overly complicated NESO has made describing what is quite a simple concept. But the challenge of getting to net zero by 2050 is enormous and our reading of the numbers works as follows:
And alongside that, heat pumps are expected to grow from 250,000 to 19 million by 2050, and EVs from 1.5 million to 30 million.
It’s heady stuff. But I’m older now, with less hair and more kids than I had in 2005, and I have three concerns:
2050 is five general elections away. At present, only Labour, the Lib Dems, and the Greens are fully committed to net zero. Other parties are ambivalent or outright sceptical. Reform UK, for example, has promised to cancel offshore wind contracts if elected.
With 20,700 politicians in the UK, it’s fair to guess that at least 5,000 are not fans of net zero. Betting that this plan survives five government changes feels well, let’s say, optimistic.
We’ve got 9,125 days to install 200,000 MW, so that’s about 22 MW per day, every day. Last year, we managed about 11.5 MW/day. We need to double that overnight and hold it at that rate for 25 years.
Given the UK’s planning system, this feels deeply unrealistic. The UK is a small densely-populated island with 22,000 people employed as town planners, and understandably, these people tend to create work for themselves.
A good example of this is the Lower Thames crossing, which you will recall is a new tunnel under a river that already has a lot of existing tunnels and bridges. But still, the planning process has now taken 10 years and cost GBP 300 million so far, all without a single spade in the ground. The total documentation required by various authorities aggregates to over 60,000 pages. All of this to build a tunnel. Under a river. A river that already has 17 tunnels.
Thinking that somehow the same planning system is going to allow 200,000 MW of wind farms, solar parks, interconnectors, and most critically nuclear power stations to be built in 25 years is unrealistic, unless the system radically changes almost beyond recognition.
NESO doesn’t say much about the costs of their ambition (less than a page in 170), but states that a detailed appendix will follow, albeit conveniently during the Parliamentary summer recess.
Our own rough numbers (2025 prices):
Total: ~GBP 383 billion, or GBP 39 million a day for 25 years.
The Government presumably hopes the private sector will foot the GBP 383 billion bill. But the UK is a small, damp island competing with the rest of Europe for capital. Our gilt yields are now the highest in Europe, which is not a great sign for investor appetite. A key part of our role at Green Giraffe Advisory is to bash UK projects into some form of investable shape, because we know the competition for capital is both global and fierce.
Secondly, of course, the impact of the planning process described above is likely to increase costs way beyond the GBP 383 million we calculated above. The much-maligned managers of HS2 have recently complained that over 100,000 people objected to their plans to build 135 miles of new railway track (in a country that already has 9,584 miles of track), over which Parliament reviewed 827 petitions. Nearly every petition subsequently required a change to their design, which massively increased costs. Eventually, they paid about GBP 350 million for each mile of track. Yes, you read that right: GBP 350 million per mile of track whereas the equivalent French TGV cost circa GBP 40 million per mile and a Chinese railway maybe costs as little as GBP 20 million. So, given our collective experience of building HS2, I think it is a fair assumption that the GBP 383 million set above will be an underestimate.
Conclusion: From scenario to reality
The NESO report is impressive, exhaustive, and physically exhausting to carry around. But as Prussian General Helmuth von Moltke the Elder put it: no plan survives contact with the enemy.
The plan is clear: 200 GW of new capacity, 19 M heat pumps, 30 million EVs, and a fully decarbonised grid. But 9,125 days is a long time, and as my own life illustrates, a lot can happen.
Building all of that on a small, densely populated island with 22,000 town planners reporting to 20,700 politicians is at best challenging. Add in an ageing grid designed around long-demolished coal-fired power stations serving long-demolished factories, and ‘challenging’ suddenly becomes ‘really challenging’.
At Green Giraffe Advisory, we’re fully committed to achieving net zero in the UK. It is pretty much all we talk about all day, every day, and we have raised GBP billions so far to build projects. But we work at the coal face of project finance, and we know what it takes to turn strategy into steel, mission statements into megawatts, and business plans into biogas.
It’s easy to write 170 pages about what should happen. Making it happen is another story, and that bit is still only partly written.
As WC Lowdermilk wisely stated, ‘Civilization rests on the soil.'” I’ve started with this quote mainly because I think Walter Clay Lowdermilk has such…

As WC Lowdermilk wisely stated, ‘Civilization rests on the soil.'”
I’ve started with this quote mainly because I think Walter Clay Lowdermilk has such a brilliant name, I wanted to shoehorn it into a blog. More importantly, he was an agronomist who wrote long, dense pamphlets about how ancient societies ultimately collapsed because they failed to look after their soil. Which brings us nicely to today’s biogas topic: the unglamorous issue of what primarily comes out of your anaerobic digestion (AD) (apart from gas), and that, of course, is digestate.
At first glance, it looks like dark, black, wet soil that smells faintly of ammonia. I t gets under your fingernails, the smell seeps into your clothes, and the last time I visited a biogas plant, the woman beside me on the train home audibly tutted, raised her eyebrows, and moved to another seat.
But if you spend a long time visiting AD plants, you come to the almost religious realisation that this dark, smelly stuff isn’t just a byproduct; it’s a signal – a pungent, nutrient-rich reminder that the energy world needs to change not just in the skies, but in the soil.
WHAT IS DIGESTATE, REALLY?
Let’s start with the basic physics. The process of converting any form of organic product into biogas (CH4 and Co2) in an AD plant doesn’t significantly reduce the mass, so you get pretty much the same weight out as what you put into the tank. If anything, the mass goes up because you have to add water to create viscosity so the stuff can be pumped around the plant.
Europe has over 10,000 AD plants, which generate more than 120 million tonnes of digestate per year. That’s enough to fill over 48,000 Olympic swimming pools or, if you’re a logistics nerd, around 6 million 20-foot shipping containers.
And what’s in it? On average, every tonne of digestate contains:
The non-watery bit makes it a competitive alternative to synthetic fertilisers, especially in Europe, which has been scrambling for fertiliser security after supply chain shocks recently caused prices to surge by 300%. Last year, the UK imported about 2.8 million tonnes of fertiliser and a lot of this used to come from Russia hence the post-Ukrainian price surge. Nowadays, we look to buy it from the Egyptians, the Americans and Trinidad and Tobago, which creates a large carbon footprint and adds massively to the carbon intensity of European farming (as per our previous blog). And this stuff isn’t cheap. A tonne of fertiliser costs about £350 which will only cover maybe 15 acres depending on what you are trying to grow, and the UK alone spends £ 1.2 billion buying it.
THE PROBLEM ISN’T THE PRODUCT—IT’S THE PERCEPTION
Although one tonne of digestate can offset half to one-third of a farmer’s annual nitrogen application per hectare, less than 30% of European digestate is processed beyond basic storage or local field spreading.
Digestate isn’t traded on global markets like oil or lithium. Its value is in my newly made-up word – hyperlocal, and that’s both the catch and the potential upside. A cubic metre of raw liquid digestate might only be worth £3–£5, depending on nutrient content. Most farmers won’t pay you to take it, and some will even charge the AD plant to take it away because it’s mainly water. One biogas plant owner I know recently told me with tearful frustration that he pays over £1 million per annum for a contractor to basically truck away tankers of dirty, brown water every day. But run this liquid through a separator, recover the ammonium nitrate, and dry the solid fraction? Suddenly, you have a competing product for that Egyptian fertilizer, and it’s produced an awful lot nearer to home.
Let’s be honest with ourselves: well-meaning Europeans shipping millions of tonnes of fertilizer halfway around the planet while agonizing over plastic straws and tote bags is the definition of missing the wood for the trees, or in this case, the soil for the sludge.
BUT HERE’S THE CATCH: FINANCE STILL HASN’T CAUGHT UP
Investors still flock to solar and wind where the output is clean, metered, and indexed. But they shy away from investing in digestate dewatering infrastructure, the prosaic technology of dewatering, drying, and pelletisers, because there’s no PPA, no offtake guarantee, and it doesn’t really feel like project finance
That’s the short-term view.
The capital cost of dewatering and pelletising this stuff is £1.5 M – £2 million, depending on throughput and technical complexity. But with fertiliser prices high and carbon intensity scores becoming mainstream, this is beginning to look more like an attractive idea.
THE ROAD AHEAD: IT’S DIRTY, BUT MAYBE IT IS PAVED WITH GOLD
No surprises here: the Germans are leading the charge. With over 9,500 biogas plants, they’re already turning digestate from a messy headache into a shiny revenue stream. After all, these are the same people who invented the Mercedes car and now somehow manage to reserve every poolside lounger in Europe by 6 am, efficiency and first-mover advantage run deep in the German psyche.
The slightly more relaxed French, Dutch, and English are scrambling to catch up, nudged along by a heady mix of policy carrots (rewarding nutrient recovery) and regulatory sticks (penalties on spraying untreated slurry on fields). The EU’s Nitrates Directive and Farm to Fork Strategy are forcing everyone to take a hard look at what’s lurking in those tanks. Where farmers once saw a stinky liability, they’re now seeing £ signs. And investors usually allergic to things not made of steel and concrete are starting to circle too. That dirty water is starting to look like liquid gold.
Some plants are going even further, turning to what might be the ultimate unsung hero of the bio world: algae. Yes, that slippery green film that clogs up your pond and takes over your fish tank the moment you turn your back. Give it nutrients, CO₂, and sunlight, and it grows faster than a spotty teenage boy on a diet of PlayStation, pizza and full-fat coke. Nutrients and Co2 are of course produced by AD plants, so farmers and biologists are starting to join the metaphorical dots and build algae factories near the plants.
To give a sense of the opportunity, the slightly ominously named algal strain Chlorella vulgaris yields about 50% pure protein if we feed it the dirty water distilled from the digestate produced by pig manure. This protein can then be mixed into other feeds and fed back to new pigs. It’s probably best if we don’t explain to the second of group of pigs the relationship between their tasty dinner and the first group of pigs but let’s just call it the circular economy in action.
FINAL THOUGHTS: BEYOND THE SHINY THINGS
Investors and magpies share two qualities: they’re not universally loved, and they both love shiny things.
Solar panels glinting in the sun, towering wind turbines, sleek EV chargers, these are the poster children of the energy transition, the stock shots of 1,000 investment prospectuses. But behind the drearily predictable photos of attractive people with great teeth in fields of solar panels lies a darker, less appealing truth: a key part of the energy transition jigsaw might just be the sludge lurking in the black lagoons behind biogas plants.
We began with WC Lowdermilk partly because he has a name that sounds like a jazz pianist, but mostly because he understood that everything ultimately rests on the soil. Fast forward 100 years: the woman beside me on the train who didn’t like how I smelled was missing the point that digestate is probably the most unglamorous, undervalued, yet vital commodity in the climate economy. Maybe if she knew that she wouldn’t have moved seats. Maybe.
As you probably already know, lutefisk is a dish made by Norwegian grandmothers where various types of white fish are soaked in water, then…
As you probably already know, lutefisk is a dish made by Norwegian grandmothers where various types of white fish are soaked in water, then dried in lye, then soaked in water again, then finally cooked into (and I am quoting here from a Norwegian cookbook) “a delicious gelatinous holiday speciality”. Lye is a strong alkali used in a lot of household cleaning products, but apparently also acts as a preservative. To those of us bought up on Sainsbury’s fish fingers and chips, Granny’s months-old dead fish preserved in what is basically drain cleaner, then rehydrated into a fish-tasting grey jelly, doesn’t sound so appealing. But apparently, it’s very popular with Norwegians at Christmas. I have my doubts about actual compared to feigned enthusiasm for Granny’s signature dish, but we digress.
What we really like about the Norwegians is what they are doing in biogas. Like the rest of this magnificent country, it’s small, clever and quietly competent. And while it won’t win many awards, it has a thing or two to teach us about pragmatism, circularity, and the kind of innovation that actually happens. Think of it a bit like your monosyllabic uncle who fixes things with a spanner and a shrug, rather than your flashier brother-in-law with his Tesla and Ted Talk.
So: let’s talk about Norwegian biogas because somebody has to.
The Basics: Land of Fjords, Fish… and Fermentation?
Norway isn’t the first country that comes to mind when you think about biogas. With more hydropower than it knows what to do with, and the largest sovereign wealth fund ever accumulated in human history, it doesn’t need biogas to solve an energy crisis.
But Norway does have an agricultural sector. It has waste. It has public transport. And increasingly, it has climate targets with real teeth. Enter biogas: not as a hero, but as a workhorse.
Norway currently produces around 0.7 TWh of biogas annually—about 70 million cubic metres. Tiny, by global standards. But that number masks something important: nearly 90% of it is upgraded to biomethane and used in transport, primarily public buses and waste trucks.
In other words, Norway isn’t just producing biogas. It’s using it intelligently.
Waste Not, Want Not
Norwegian biogas is almost entirely waste-based. Food waste, manure, fish processing residues (the latter is a polite euphemism for something really much nastier) – you name it, if it’s a long-chain hydrocarbon, the plucky Norwegians will try to turn it into gas. The country banned biodegradable waste from landfills in 2009, which means anything organic has to go somewhere else. Anaerobic digestion (AD) became the logical home.
This is a critical distinction. Much of continental Europe still relies on food crops to feed digesters, which is a bit like growing maize to heat your pizza oven. Norway, by contrast, builds its biogas sector on the back of real circular economy principles. It’s the difference between climate accounting and climate action.
And the feedstocks are geographically appropriate. Norway’s west coast is a hub for aquaculture, meaning lots of that nasty “fish residue” stuff. Inland regions like Trøndelag supply dairy waste. Oslo, the bit where most Norwegians live, provides urban food waste and the other ‘stuff’ that Oslo people produce a day or so after eating.
It’s a jigsaw puzzle—messy, decentralised, and hard to scale. But it’s also resilient.
Public Money, Public Purpose
Let’s not pretend this is all the result of free markets and Viking pluck. Norwegian biogas has been heavily supported by the state, through Enova (the state climate investment fund), Innovasjon Norge, and generous feed-in support for biomethane in transport.
But here’s the difference: the support isn’t trying to create an abstract green megatrend. It’s solving real, local problems.
Want to decarbonise Oslo’s public transport? Use local food waste to fuel Ruter buses. Need to manage manure in central Norway? Build a co-digestion plant and feed the resulting gas into a small local grid or, better yet, a dairy truck fleet. It’s targeted, fit-for-purpose, and grounded in the kind of logic that rarely makes it past the strategy slide in a multinational boardroom.
And it works. Norway now has over 700 biomethane-powered buses, with more on the way. The city of Trondheim now runs some of its waste collection fleet on locally sourced biogas and is phasing out diesel trucks.
This isn’t greenwashing. These aren’t unicorn valuations. Just a boring sector doing a boring job every day, but it’s sustainable and it actually happens.
The banks are quietly starting to take notice, and we are super pleased to have just closed, the signing of a financing agreement for the construction of the Hardanger Biogas plant. This is greenfield bio-LNG facility located in Husnes Industriområde on the Norwegian west coast. This plant will process approximately 120,000 tons of feedstock annually, consisting of manure, that fish residue stuff and food waste, and aims to produce around 90 GWh of liquefied biomethane each year. We are tearfully proud to be associated with it.
The Hard Stuff: Digestate, Permitting, and the Scaling Ceiling
Of course, it’s not all fjord-side serenity. Norwegian biogas faces the same challenges as everywhere else.
Digestate the semi-liquid byproduct of AD is an ongoing headache. Spreading it as fertiliser is fine in theory, but is subject to strict rules as its full of nitrogen, so had to be applied carefully. Transporting it across long distances is expensive and ruinous for carbon intensity scores.
Permitting is another bottleneck. Norway’s famously rigorous environmental review processes mean that projects can get stuck in the system for years. The flip side is that once they’re built, the plants tend to be well-integrated, with high public trust. (Compare that to the Netherlands, where opposing planning for pretty much anything has become a national pastime.)
And then there’s scale. Norway simply doesn’t have the volumes of waste to fuel a biogas sector of German proportions. At most, the country could double or triple its current output. That’s respectable but it won’t move the dial much on global carbon emissions.
There’s a phrase we like in renewable finance: “Scalable solutions.” It’s the codeword for project that get attention, capital, and hopefully eventually a government minister cutting a ribbon to open your new project. That’s why pictures of offshore wind get put on the front of infrastructure fund’s glossy brochures and biogas gets relegated to the section at the back called “other technologies”. Biogas is much harder to scale which leads us to the real question: What’s the point?
Biogas as a Strategic Asset
Here’s the thing. If you judge biogas purely by volume, you’ll miss the value. Norway isn’t building a biogas sector to compete with LNG. It’s building it to:
It’s not a headline strategy. It’s a support beam in a wider play about making an already nice and green country just a little bit nicer and greener.
And in a world increasingly obsessed with scale and disruption, that kind of quiet utility matters. Because the energy transition isn’t just about building big things, it’s about making everything work better. Biogas is the lubricant in that machine.
Lessons for Investors and Policymakers
If you’re a trophy-hunting infra investor, Norwegian biogas probably won’t dazzle you. Projects are small. Timelines are long. The Hardanger project took a year from soup to nuts—and by soup, we obviously mean liquefied cow manure and cod intestines.
But if you care about portfolio resilience, localised decarbonisation, and circularity that actually happens outside of PowerPoint decks—this sector is worth watching.
For policymakers:
And please, standardise digestate rules. Because nobody should need a PhD in nitrogen management just to fertilise a turnip.
For investors:
Conclusion: Modest, Mature, and (Almost) Invisible
Norwegian biogas won’t save the world. But it’s not trying to.
It’s a sector that understands its purpose, plays to its strengths, and avoids the hype. It’s locally rooted, circular by nature, and remarkably efficient. In other words, it’s everything a serious energy transition needs but rarely gets.
So no, you won’t see Norwegian biogas at the top of your next infra fund press release newsletter. And you probably won’t be making lutefisk for Christmas any time soon (please don’t). But if you see a bus in Bergen running on biomethane made from old cod heads and cow manure, give it a respectful nod. It’s doing more for climate action than a dozen policy conferences in far-off places.
In George Orwell’s excellent satire on communism, Animal Farm, the early ideals of the revolutionary pigs are compromised and by the end of the…

In George Orwell’s excellent satire on communism, Animal Farm, the early ideals of the revolutionary pigs are compromised and by the end of the story we end up in a place where the big slogan on the barn wall is amended to “all animals are equal, but some animals are more equal than others”. We think that the same thing applies to biogas but this time in a good way.
As you will recall from previous blogs, biogas is made by putting organic material into big tanks and in the absence of oxygen (hence anaerobic) tiny bacteria break down the long chain hydrocarbons to release methane (CH4) and CO2. Your stomach does pretty much the same thing which is why you burp and fart. This biogas can be burnt in engines to make electricity or upgraded to biomethane by separating the CH4 from the CO2 using membranes.
However, as with George’s cows and the pigs, although it is the same gas, not all biogas is of equal merit. Following our farmyard theme, the biogas that comes from manure is good because it avoids uncontrolled methane emissions and displaces fossil fuels. The same gas that comes from growing millions of acres of maize is not as good. The thing that differentiates the two is of course the carbon intensity of the production process, but you probably already knew that.
The Basics: What Is Carbon Intensity — and why should we care?
To get everyone on the same page, Carbon Intensity (CI) is the kg of CO2 equivalent grams of CO₂ equivalent per megajoule of energy (gCO2e/MJ) produced. For biogas, it means calculating the CO2 emissions from:
This number, your CI score, now decides whether your project:
Maize-Based Biogas: Renewable? Technically. Green? Not So Much.
For maize based biogas, the CI score is the big snorty elephant in the corner of the room. Maize is the biogas world’s favourite feedstock because its reliable, high gas yielding per ton and massively scalable. But is it climate-friendly? Well, no not really.
Growing huge fields of maize for digestion comes with all the accompanying trimmings: fertiliser, irrigation, chemicals for pest control, diesel-fuelled tractors and combine harvesters all pumping out tons of CO2 throughout the growing season just to produce a supposedly green alternative to natural gas. At an absolute push, the CI score of biogas maize is maybe +25 gCO2e/MJ which just about limbos under regulatory thresholds, but only if you squint and use generous default assumptions.
It’s a bit like claiming health benefits from a deep-fried salad. It’s sort of green but not really if we are brutally honest.
Meanwhile, projects digesting animal manure, food waste, or landfill gas are delivering actual emissions reductions and often net-negative carbon intensities because left untreated, the original feedstock would produce methane in an uncontrolled way which as we know is much more harmful. So, the very act of capturing that methane means you start from a place of negative carbon emissions. This is the Holy Grail of renewable energy, not just reducing the impact of climate change but actually putting it into reverse. Biogas made from manure has a CI score of negative -150 to 300, so every unit of gas reduces the equivalent amount of CO2 in the atmosphere.
To put this into context, burning fossil fuel gas has a score of +90 and as above, biogas from maize is plus 25 gCO2e/MJ so you can see how much better it is to make gas from manure.
RGGOs: Good Start, Needs Work
This leads us on to the use (or lack of) CI scores in Renewable Gas Guarantees of Origin (RGGOs). As you will recall, RGGOs, or their European cousins, GGOs are certificates awarded to biogas producers for every unit to certify their gas is renewable. These certificates can then be sold to gas wholesalers and industrial corporates to offset their CO2 emissions from burning fossil fuel gas. Think of them as name tags for molecules on your party guest list that say “Hello, although I’m a gas, I’m renewable!” (as a brief aside, I once went to a posh law firm’s corporate event where my lanyard said “Michael Ware, B List invite” – true story).
But there’s a problem: GGOs don’t really care how renewable the molecule actually is, as CI scores are not a primary consideration. As long as you breathe in hard and sneak below the threshold, they give the same status to a m3 of biogas from maize as a m3 from food waste. Even though the former produces a lot of net CO2 via fertiliser, burning diesel etc., and the latter doesn’t and actually reduces emissions overall.
Both Infrastructure funds and corporate buyers are starting to notice this and feel a bit uncomfortable. It doesn’t sit too well with your pension fund investors if their £100m flagship green biogas plant is built on a feedstock foundation of hundreds acres of monoculture maize. This maize is regularly drenched with chemicals and tended to by dozens of diesel burning tractors and combine harvesters just so you can claim it’s good for the planet. With a positive CI score, the subsequent RGGOs are just little bits of green paper literally papering over the cracks of your plant’s net CO2 emissions.
Enter: The Voluntary Carbon Market – Where Carbon Intensity = Cash
Thankfully, things are a bit better in the Voluntary Carbon Market (VCM). This is where companies buy certificates to offset their emissions and stay within their emissions trading allowance. This is where certificates with negative CI scores become very valuable because they reduce emissions on two fronts. As a result, they are very much in demand and certificates with negative CI scores are much more valuable than their CI indifferent RGGO rivals. This fact is starting to filter down to both plant operators and their investors and we increasingly speak to lots of plant managers who live and breathe their daily negative CI score (obviously metaphorically, not literally)
In a few short years, the bio methane industry has gone from virtually nothing to over 1,600 gas-to-grid plants and maybe 7,000 gas-to-engine ones. This astonishing growth has been fuelled originally by electricity subsidies (and hence the huge number of gas-to-engine plants) and more recently by certificates. That said, we have to some extent taken our collective eye of the ball and by allowing subsidy chasing CO2 emitting maize based plants to proliferate we have given a lot of metaphorical ammunition to the anti-green gas lobby.
Subsidy-based schemes for new gas to engine schemes have largely ended although surprisingly the UK and Italy are implementing new gas-based tariff schemes. However, most commentators expect existing tariff schemes to be extended, and this is an opportunity for Governments to bring in CI measurement across the board.
So, What Needs to Change? Glad You Asked.
Final Thought: Biogas – Is it a tool in the energy revolution or just greenwashing?
Spoiler alert but ultimately Animal Farm is a depressing book. The revolutionary little pigs have big ideas but end up being as bad as the capitalist farmers they displaced. Biogas was for a period in danger of going the same way. Creating CO2 to claim green subsidies doesn’t look much like the original plan and has given the sector a bad reputation with some policymakers and investors. The introduction of certificates with accompanying CI scores is a real game changer and puts biogas at the forefront of the energy revolution. But this will only work if we stop pretending that all feedstocks are equal and start using and publicising carbon intensity as the one metric to assess all feedstocks by.
In the end, it’s not about what your CH4 molecule is made of, it’s about what it avoids. If we make biogas with a negative CI score and this displaces fossil fuel gas, then we start to actually reverse climate change by a tiny amount with every M3 of gas we produce. The little pigs didn’t succeed in revolutionising agriculture, but we may have more of a chance when it comes to gas.
On the 1st March 2024, I looked at myself in the bathroom mirror and realised I had inexorably become a bald, fat bloke. A…

On the 1st March 2024, I looked at myself in the bathroom mirror and realised I had inexorably become a bald, fat bloke. A combination of eating too much cheese and drinking too much beer has led me to steadily gain weight until I was a chunky 260 pounds. So, I started on Wegovy with a clear plan to lose 75 pounds by 31st December 2024. It has somewhat worked; I’ve lost 51 pounds. However, I woke up on New Year’s Day about 33% short of my goal. And that’s okay, because I only set that deadline for myself, and to everyone else, I was just losing weight. So, how much, and by when was irrelevant; it didn’t undermine the point of what I was trying to do. And this is where we segue into renewable energy, the UK Government’s ambitious plan to decarbonise the grid by 2030 and why the UK may not meet that deadline could undermine the wider green energy revolution.
The UK Government has been very clear in its ambition – they want to shift to a net-zero electricity system by 2030. It’s important to note this target applies only to electricity, not total energy (like heating or transport). Still, it’s ambitious. On various days in January, over 60% of UK electricity was gas-powered. On one memorable day – 22nd January, less than 1% came from wind or solar.
You can read how this is to be achieved in the National Energy System Operator’s (NESO) clean pathways plan: https://www.neso.energy/document/346651/download
To reach net zero by 2030, NESO’s well-meaning experts identify two requirements that have to happen within five years. First, the UK grid’s renewable generating capacity must increase by roughly 81 GW. This means growing onshore wind from 14 GW to 27 GW, offshore wind from 15 GW to 50 GW, and solar from 14 GW to 47 GW.
The second big assumption in the NESO plan is that demand flexibility grows to 12 GW. To put it another way, this is 12,000 MW of consumption that shifts away from peak times to off-peak times. The NESO report excitedly discusses smart technologies and instant consumer reaction to pricing signals. However, it begrudgingly admits this relies on consumers choosing, for instance, to turn off their tumble dryer in the evening. As a result, ‘some commentators think the levels of assumed demand reduction in our pathways are too ambitious”.
I hate to be the one to break this to NESO, but a lot of us in the renewable energy industry think that all of the assumptions underpinning all of the pathways in their plan are too ambitious.
Going back to the generation part of the plan, NESO is assuming 81 GW of new renewable generation by the end of 2030. This equates to roughly 16,200 MW per year, or a more meaningful 44 MW installed per day. This rate is required every day for the next five years, seven days a week, including Christmas and bank holidays. Last year, the rate of installation of renewable energy in the UK was about 2.8 GW or 7.67 MW per day. Historically, it has taken us 20 years to grow from 5 GW to 48 GW, averaging about 5.89 MW per day. NESO’s plan assumes the daily installation rate will somehow grow by a factor of six to 44 MW per day, almost overnight. This growth is attributed mainly to relaxed planning laws and improved grid queuing. They believe this reduction in a pesky bureaucracy is all that’s needed for the UK to suddenly become an enormous building site of wind and solar farms. This seems unlikely at best. Moreover, every day we fall short of that target, the required daily rate for the remaining period until 2030 increases beyond 44 MW.
But why does it matter? Like my weight loss, you may reasonably argue that arbitrary time-based targets for renewable capacity installation aren’t really necessary as long as things are going in the right direction, and even 7 MW of new installs a day adds up in the long run. However, I don’t think we can be that relaxed. Those of us who believe in the energy revolution face two regular challenges when we tell strangers our profession at the pub: ‘global warming isn’t happening’ (yes, it is) and ‘the Chinese are building coal-fired power stations, so what’s the point?’ (they are also world leaders, installing renewables at an astonishing 758 MW per day in 2024). Now, NESO is opening the door to a new challenge: ‘Well, of course, it can’t be done in the West anyway.”
We need to keep doing the right things, but also treat the British public like grown-ups. Promising unachievable outcomes does our industry no favours; it actively undermines what we are trying to achieve. Yes, set ambitious targets, recognising the realities of building infrastructure in the UK. Aim for maybe 10 – 15 MW of installed capacity per day, compared to the 7.67 we achieved in 2023, but seriously, don’t make it 44. Even 20 MW installed every day for the next five years is a delusional fantasy. This rate has never been achieved in any of the last 20 years of trying, despite the Government spending billions on Contracts for Difference, ROCS and FiTs.
Nothing truly bad would have happened if the UK hadn’t set an 81 GW new capacity target by 2030. Globally, the UK contributes less than 1% of all CO2 emissions. So, a small rainy island off the coast of Europe setting a less ambitious renewable energy target would hardly have moved the global political dial.
But a government setting a very public, high-profile ambitious target, then falling short, matters much more. The UK risks becoming a global case study of green policy failure. It could show politicians in ivory towers having big lofty ideas that don’t survive contact with reality. As the Soviet scientist Valery Legasov said at the Chernobyl trial: ‘Every lie we tell incurs a debt to the truth. Sooner or later this debt is paid.’ This is the proverbial thread in the jumper. If we pull it by misleading the public about the idea of 44 MW versus the reality of 7 MW per day, where does the thread stop unravelling? If we knowingly overstate how much capacity can be installed that quickly, then maybe we are overstating the scale of the climate change problem. We in the industry live and breathe this stuff everyday, but your average voter on the street doesn’t. It comes up occasionally, and they probably don’t engage in the details. If we get to 2030 and, as seems likely, fall far short of a net-zero grid in the UK, global critics may use this as ammunition. They could claim the entire revolution is an unachievable fantasy, a publicly funded chimera. As we’ve seen with Trump, the political wind can turn against renewables very quickly. Once public trust is lost, it’s rarely regained. It’s too late now to put the 81 GW by 2030 genie back in the NESO bottle, but it would be helpful if we were more honest about how truly hard this will be.
MEET THE TEAM

Managing Director Paris
Pierre-Etienne is a founding partner of Green Giraffe Advisory and an industry veteran with extensive experience successfully guiding clients and closing complex transactions across diverse markets and technologies.
Over the past 15 years, he has built a track record of transactions globally, specialising in large-scale non-recourse and holdco debt financings, and M&A (buy-side, sell-side, and corporate fundraising) spanning a diverse portfolio of energy transition projects and platforms. His transaction experience is structured across three key areas:
Benchmark offshore wind M&A and debt: He has overseen numerous fundraising efforts for major European offshore wind projects, including non-recourse debt financing for developments exceeding 1 GW in capacity. Key mandates include advising on major asset sales for offshore wind projects, managing platform M&A, and executing debt restructuring mandates. Before founding Green Giraffe Advisory, Pierre-Etienne spent four years in Dexia’s project finance team, where he closed multiple transactions across public-private partnerships, transportation asset financing, and renewable energy sectors, including solar, offshore, and onshore wind farms.
Pierre-Etienne graduated from École Centrale de Lyon and holds an MSc in Finance from ESCP-EAP Business School in Paris.

Managing Director – Head of Green Giraffe Advisory Hamburg
Udo is a managing director of Green Giraffe Advisory and co-heads the Hamburg office
Since joining Green Giraffe in 2015, he has advised on multiple sell-side and buy-side equity transactions, as well as debt raises and provided commercial contracting advice for complex energy transition projects at different development stages and in different countries. He is also providing advice on tenders and renewable energy offtake solutions
Amongst others, he has led the debt raise for the 1.2 GW Baltic Power offshore wind project in Poland (ongoing) and debt finance for an innovative geothermal project, supported developers in offshore wind tenders and headed the M&A transactions for the offshore wind projects TWB II (200 MW, DE, 2017), Global Tech I (400 MW, DE, 2020), and Gode Wind I (347 MW, DE, 2018) as well as the development, structuring and sale of a Polish 350 MW offshore wind project to RWE. He also supervised the M&A transaction leading to the creation of Alterric (JV ENERCON & EWE) and is contributing to establishing a new green hydrogen economy
Before joining Green Giraffe, Udo worked in the infrastructure finance and renewables team of PwC for 14 years advising investors, developers and industry players on several onshore and offshore wind projects as well as infrastructure and public private partnership projects globally
Udo holds a bachelor of business in finance from the University of Technology, Sydney, and graduated from Hamburg University with a degree in economics

Managing Director – Head of Green Giraffe Advisory London
Clément is a founding partner of Green Giraffe Advisory. Based in London, where he established the firm’s office in 2011, he brings extensive expertise across the offshore and onshore wind sectors, advising on both equity and debt financing. Between 2017 and 2019, he led the Paris office before returning to London to support the firm’s continued growth.
He is a recognised thought leader in renewable energy and a frequent speaker at industry events, offering strategic perspectives on bankability, market dynamics, and commercial positioning for clients across the energy transition.
His transaction experience includes:
Before founding Green Giraffe Advisory, Clément worked in project finance at Dexia in Paris (2008 – 2010), preceded by a tenure with the Agence Française de Développement (AFD) in Beijing (2006-2007). He is a graduate of École des Ponts ParisTech and holds an MSc in Project Finance from Université Paris X.

Managing Director Utrecht
Barbara is a founder of Green Giraffe Advisory. She has a strong track record in the contracting and financing of onshore and (offshore) wind farms in Northern Europe
Barbara supported the development, contracting, and (re)financing of Northwind (216 MW, Belgium, 2012), Gemini (600 MW, the Netherlands, 2014), Veja Mate (402 MW, Germany, 2015), Norther (370 MW, Belgium, 2016 and 2020), Windpark Fryslân (383 MW, The Netherlands, 2019), Baltic II & Co (1.5 GW, Poland, 2019), Windpark Zeewolde (322 MW, The Netherlands, 2020) and Deutsche Bucht (252 MW, Germany, 2021). She has been supporting consortia participating in several European offshore wind tenders as well as having been involved in other technologies such as the ground-mounted solar farm Duurkenakker (64 MWp, The Netherlands, 2020)
She is currently involved in raising financing for a portfolio of projects that combine on-site renewable energy generation with electric vehicle charging infrastructure and battery storage
Before founding Green Giraffe, Barbara worked at the project developer Econcern, and as investment banking trainee at ABN AMRO
Barbara is recognised in the top 100 most influential female business leaders in the 2024 Women in Power list

Managing Director Paris

Managing Director – Head of Germany Hamburg
Kai is a Managing Director at Green Giraffe Advisory and heads the Hamburg office. He brings almost 20 years of experience in the energy transition and renewable energy finance.
Since joining Green Giraffe in 2019, Kai has led numerous landmark transactions in the offshore and onshore wind, solar PV, EV charging and battery storage sectors. Kai’s most recent achievement includes supervising the major corporate refinancing of EUR 435 M for EEW Group.
He has led several financings in the offshore wind space for Global Tech I, Baltic Power or Veja Mate, whilst also being active on the buy- and sell-side for offshore and onshore wind farms, solar PV platforms, EV charging, grid infrastructure, and BESS assets.
Prior to joining Green Giraffe Advisory, Kai spent 11 years at Deutsche Bank’s infrastructure and energy team (part of 18 years total at the bank), where he structured Europe’s largest solar PV project bond (€404M, Spain, 2016).
Kai has a Master’s degree in Business Administration from the University of Hamburg and studied at Aarhus Business School.

Senior Director – Head of Africa Cape Town
Offshore wind | Onshore wind | Solar PV | Hybrid technologies
Frederico has focused on complex and cutting-edge transactions. He has led transactions in tender support as well as debt and equity raising globally with a recent focus on emerging markets particularly in South Africa and the broader African continent

Senior Director – Head of Australia Sydney
Onshore wind | Solar PV | BESS & grid | Offshore wind | Hydrogen & e-fuels
Debt advisory | M&A: sell-side and buy-side | Tender support
Marcus heads the Australian office. He has experience leading debt and equity transactions across Australia and the UK. Before joining Green Giraffe Advisory, he spent 6 years at IDCM, a debt boutique in London. Prior to that he was at EY

Senior Director – Head of Japan Tokyo
Jun is in charge of leading and managing the Tokyo office. With over 20 years of experience in renewables and investment banking, he has contributed to the development and realisation of more than 50 utility-scale renewable energy projects totalling more than 1 GW of installed capacity in Japan

Senior Director – Head of UK and Ireland London
Yusuf Thanawala is a Country Manager UK & Ireland at Green Giraffe Advisory, responsible for leading and expanding the firm’s UK franchise. He brings more than 20 years of experience in investment banking and corporate finance, including over a decade focused on the energy transition, renewable energy and power infrastructure sectors.
Yusuf has advised developers, infrastructure investors, private equity sponsors and strategic corporates on a broad range of transactions across solar PV, battery storage, onshore and offshore wind, EV charging, smart metering, biogas, district energy and grid infrastructure.
His experience spans IPP platform sales, portfolio disposals, minority and majority stake investments, growth capital raises, acquisitions and strategic partnerships across the UK, Europe and the Middle East.
Prior to joining Green Giraffe Advisory, Yusuf was a Director at Akereos Capital, where he played a leading role in building the firm’s M&A advisory franchise and advising on numerous landmark energy transition transactions across Europe.
Previously, Yusuf spent almost a decade at HSBC in the Power, Utilities and Renewables investment banking team in London and Dubai. He also worked at Credit Suisse in the European Energy team, advising clients on M&A, IPOs, equity raisings and acquisition financings across Europe, the Middle East and emerging markets.
Yusuf holds an MBA in Finance and a Master of Commerce degree from the University of Mumbai.

Senior Director – Head of Singapore Singapore
Will is a Director and Head of Singapore office. He has worked on transactions and tenders across four continents, with a particular focus on offshore wind. Prior to joining Green Giraffe Advisory, Will worked at the oil & gas team of Continental AG, a multinational engineering firm

Senior Director – Head of Southern Europe Madrid
Solar PV | Offshore wind | Onshore wind | Hydropower | Hybrid technologies | Heat
Debt advisory | M&A: buy-side and sell-side | Tender support | Equity raising | Strategy
Raúl leads Green Giraffe Advisory’s commercial operations in Southern Europe. He brings over 15 years of experience advising clients on energy transition transactions, with a strong focus on debt structuring, M&A and financing. Prior to joining Green Giraffe, Raúl spent 3 years at Astris Finance, and previously held roles at BBVA and ACS.

Senior Director Utrecht
Jakob Bergvelt is a Senior Director at Green Giraffe Advisory, with 14 years of expertise in renewable energy finance. He has been a driving force behind the execution of landmark offshore wind, onshore wind, and solar PV transactions across Europe.
Specialising in complex debt-raising and investment strategy, Jakob has guided clients through large-scale financial closings and competitive tender processes. His expertise spans the full project lifecycle, including advising consortia on bid structuring in the Netherlands, Germany, Belgium, and Poland.
Most recently, Jakob led the financing for the 1.14 GW Baltic Power offshore wind farm in Poland – one of the world’s largest – successfully reaching financial close for Northland Power and ORLEN. His extensive track record also includes milestone projects such as Gemini, HKZ 1&2, Norther, Zeewolde.

Director Madrid
Ramona brings expertise across a broad spectrum of transactions, including early-stage equity fundraisings, corporate and asset-level M&A on both the buy-side and sell-side, competitive tender processes, and debt advisory mandates such as greenfield financings and refinancings. Her work is primarily focused on Europe

Senior Director London
Michael has been leading several deals, in particular in waste-to-energy, anaerobic digestion, solar and battery energy storage. Michael has a high profile in the renewable energy industry due to his work in the media and his role as part-time writer for the Spectator magazine

Director Hamburg
Offshore wind | Onshore wind | Solar PV | BESS & grid
M&A: sell-side and buy-side | Debt advisory | Tender support
Felix is a project manager in the Hamburg office. He has more than 12 years of track record in renewable energy M&A, finance and structuring
Before joining Green Giraffe Advisory, he worked in various commercial and management roles at UKA, Prime Capital and DZ Bank
No experts match your filters.